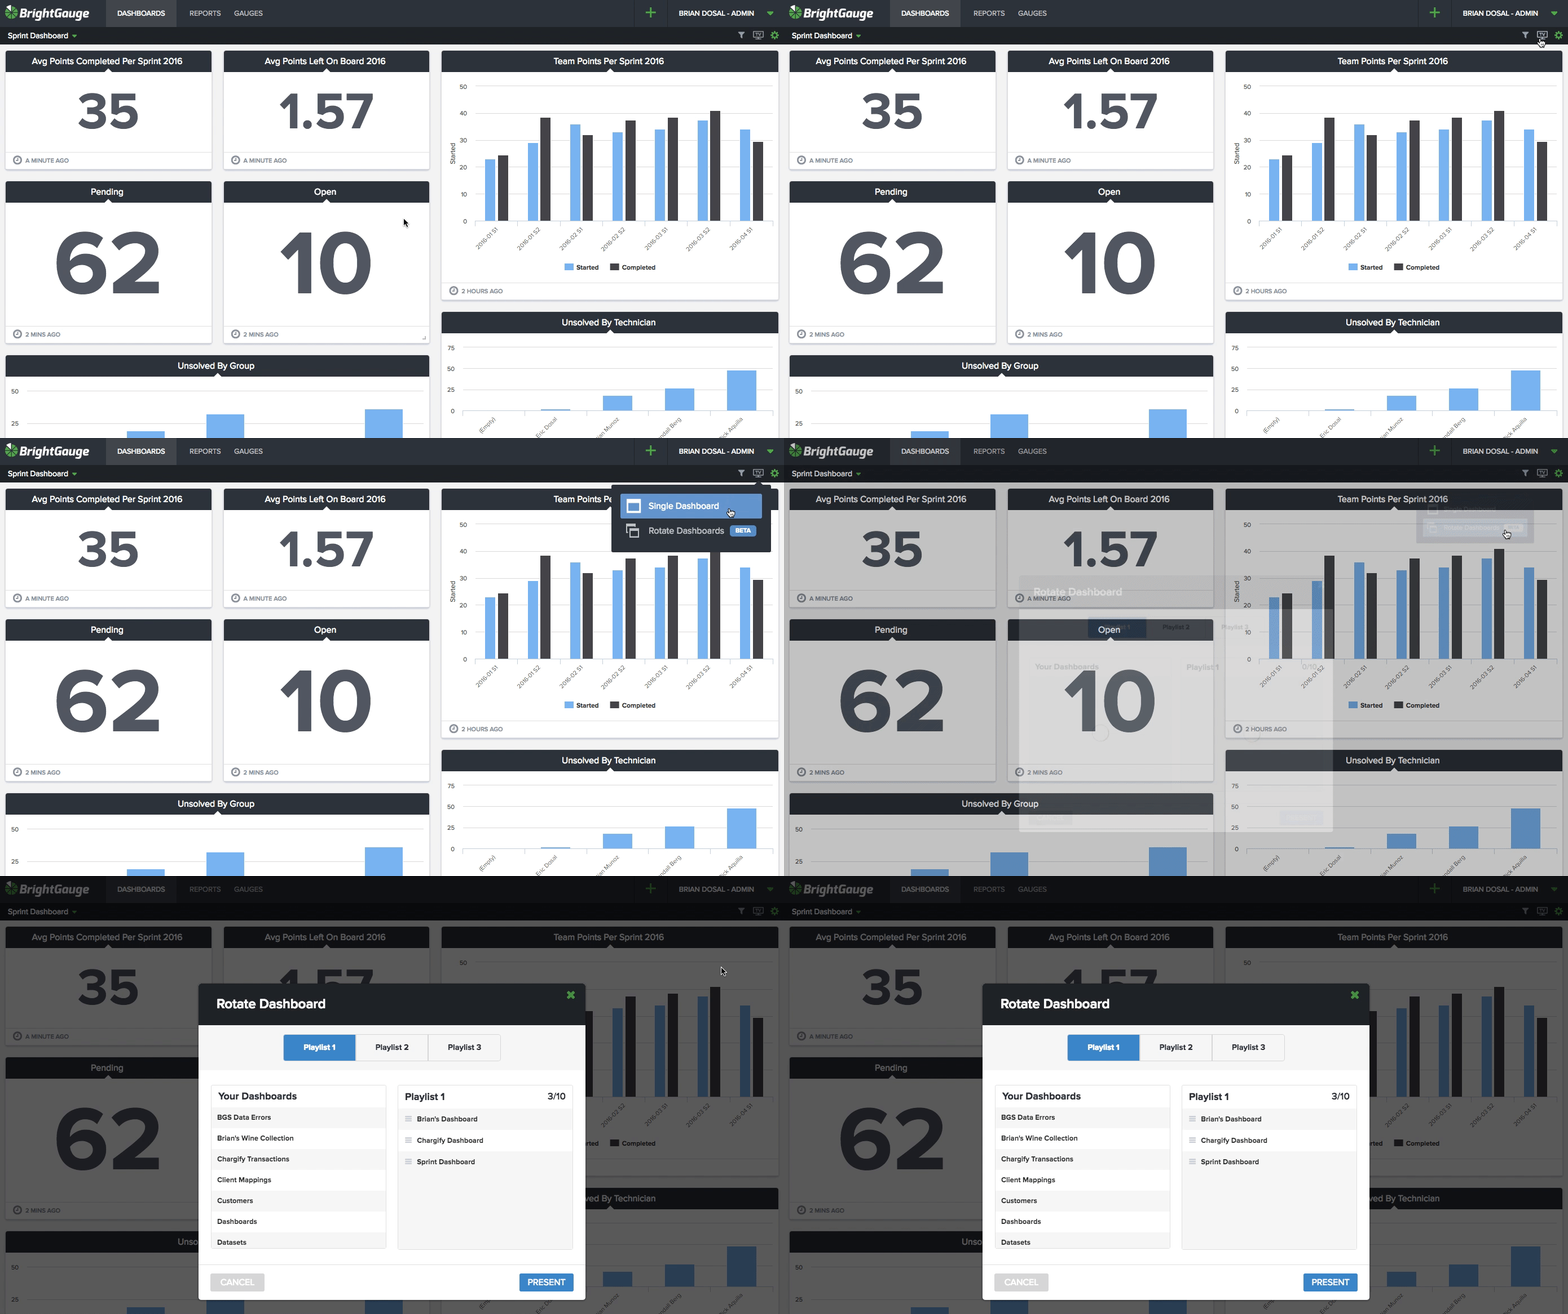
Just when you were considering how many more screens would be necessary to showcase all your best metrics, the team at BrightGauge saves the day with an exciting new update! With our new rotating ...
Just when you were considering how many more screens would be necessary to showcase all your best metrics, the team at BrightGauge saves the day with an exciting new update! With our new rotating dashboards feature, you can now keep as many gauges as you need in sight. No more trying to squeeze as much as possible into one display… give your data the space it needs to shine! Currently, the interval / timer is set to rotate a dashboard every 2 minutes and the next dashboard will fade in when it’s time. Plus, you can always pause the rotation if you would like to stay on a dashboard for a while and you can skip ahead to another dashboard from the dropdown list in TV mode. Here’s how rotating dashboards work: When viewing a dashboard and clicking on the TV button on the top right, you are now presented the option to select a single dashboard (the one you are on) or to rotate dashboards. If you select rotate dashboards, a modal comes up with the option to choose a playlist to play or to configure a playlists. There are three playlists and each one is private to your user account so not to worry, customize away! You can drag dashboards over from your list on the left and re-order as you please on the right. The playlists are saved when you press “Save & Present” or “Present” so you can reuse them over and over again. (get all the details here) Now, get to rotating some of your favorite dashboards and let us know what you think about this new feature!
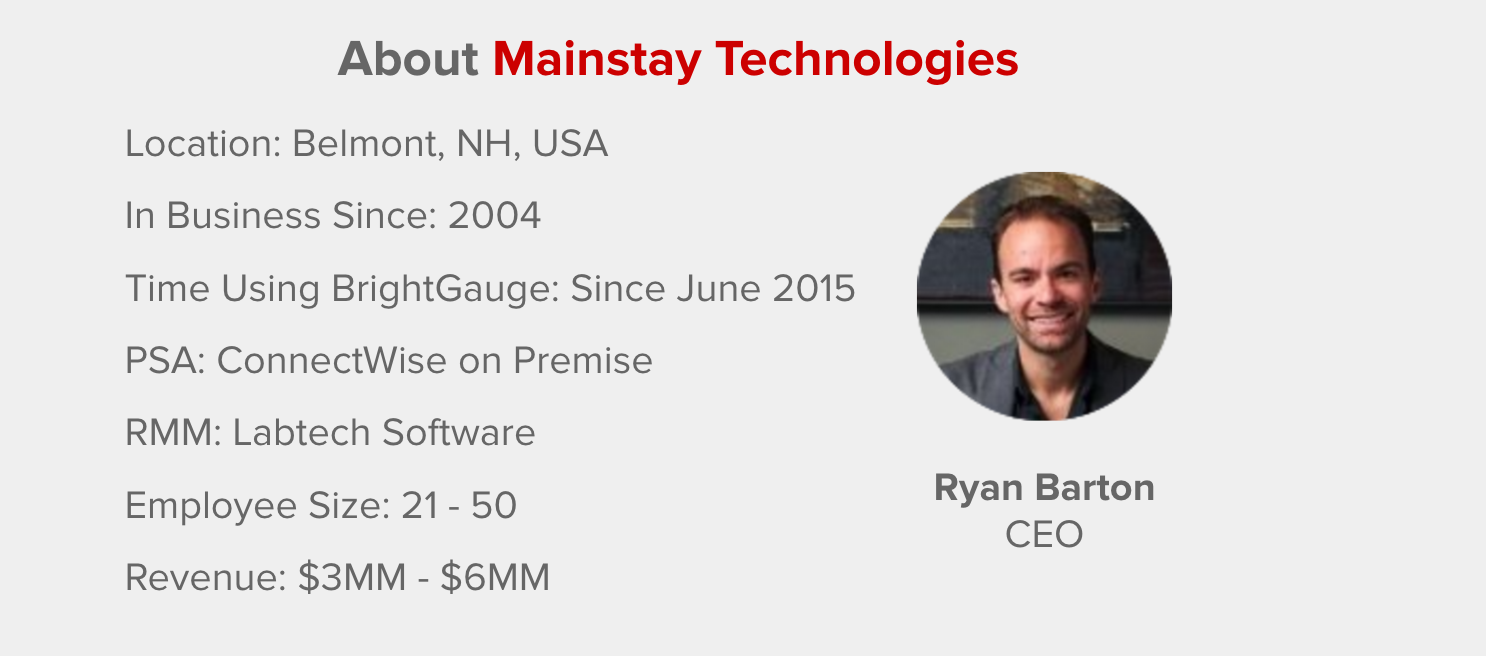
[Case Study] In days past, the team at Mainstay Technologies had no Business Intelligence solution. They utilized reports available in their ConnectWise and LabTech, or built SQL reports from time to time, but the process was slow and didn’t always look good enough to share with clients. Mainstay CEO, Ryan Barton, knew that visualizing data, understanding it and the things related to it would be the key to best govern the actions necessary for the growing IT Services company. But he was also frustrated that his team didn’t have enough visibility from their PSA and RMM data, because that’s where 98% of their business is. The more he studied the correlation between good data and good judgement in business, the more Ryan knew it would be difficult to grow and have a good sense of where they are if the team didn’t have a handle on their data. There were times when a huge problem was looming for months but since the team lacked the necessary insights, nobody realized the issue until it was too late - like the time patches weren’t installing properly for months on end. Adopting BrightGauge When he started looking for a customizable BI solution, Ryan demoed several different solutions priced at tens of thousands of dollars per year, plus extensive time would be necessary to get any of the products working specifically for a MSP. That’s when it dawned on him that what Mainstay really needed was a tool that really understands the MSP industry and had the defaults and templates built out already. As Ryan explains, “if you put a red slice of pie on the tv on the wall, it’s going to drive action in a way that talking about it never will”. Once Ryan made the decision to join the BrightGauge community, each area of the business was able to identify and implement the best solution that would help them properly track their KPIs, whether it was dashboards, internal or external reporting. For example, in Centralized Services, they use dashboards and are constantly watching what updates and antivirus are doing. When it comes to clients, reporting is a big value add. Mainstay focuses on 2 primary reports. First, there’s a client-facing one that drives conversation and shows the value and visibility into what they are doing. Ryan emphasizes that it’s exciting for his team to hear feedback from operationally-astute customers because those organizations immediately see the Business Intelligence that Mainstay is leveraging, and it gives them a great competitive edge. Second, there’s an internal report that tracks ticket trends, feedback scores, response times, infrastructure health, aging summaries (over 5 years, expired warranties, etc.) and even financial profitability. The ability to sit with the team and do a quick planning session is now almost effortless because the data is right in front of them. As for the impact his BrightGauge has on asset management, Ryan explains that because Mainstay has a defined minimum standard for service delivery and can keep clients at that point, the result is noticeably less stress within the team. With a more standardized setup, the team has become far more efficient at delivering service and driving more projects when gaps are identified. The result is more problems solved, increased revenue, more efficiency, higher team satisfaction, and of course even more client satisfaction (you remember... the well-known sentiment that happy employees equal happy customers!) Results with BrightGauge Since their BrightGauge integration, Mainstay now has more visibility and command over centralized services than they ever had before. Plus, with their new ability to put specific processes and operations in place, Ryan and his team have more confidence in their data because it can now be put into an actionable format. By utilizing BrightGauge for their Business Intelligence solution, Mainstay has “transformed from being at the industry standard install rate of about 95%, to now about 99% because we have the exact visibility into when updates were last installed and on which machines, how many are missing, and when they were last rebooted. We can see it, customize it, and immediately get answers to questions”. While the team started with BrightGauge in Centralized Services, Ryan was quick to realize the potential at hand for other areas of the business that could be positively impacted with more visibility. In no time, the team was leveraging data to track infrastructure health, service management for stale tickets, project management, client management, individual accountability, uptime, system health, and more. When those areas were up and running, Mainstay decided BrightGauge could help with staffing and capacity decisions, track who’s solving which tickets and the different types of tickets, trend analysis, and the number of tickets as compared to the number of hours and response times. Ryan sums it up best when he explains “having visibility into our data with access to the kinds of customization that makes it accurate and in a meaningful format, actually drives action”. Recommending BrightGauge For MSPs who are just getting started on their data journey, Ryan offers a bit of advice: “start with one challenge that you know good data will help to solve and if you can just focus on that one thing and rally around it, then you will start to see results instead of doing 40% on several different projects. Most companies get caught by the gaps they didn’t even know were there. Good data allows you to be proactive rather than reactive."
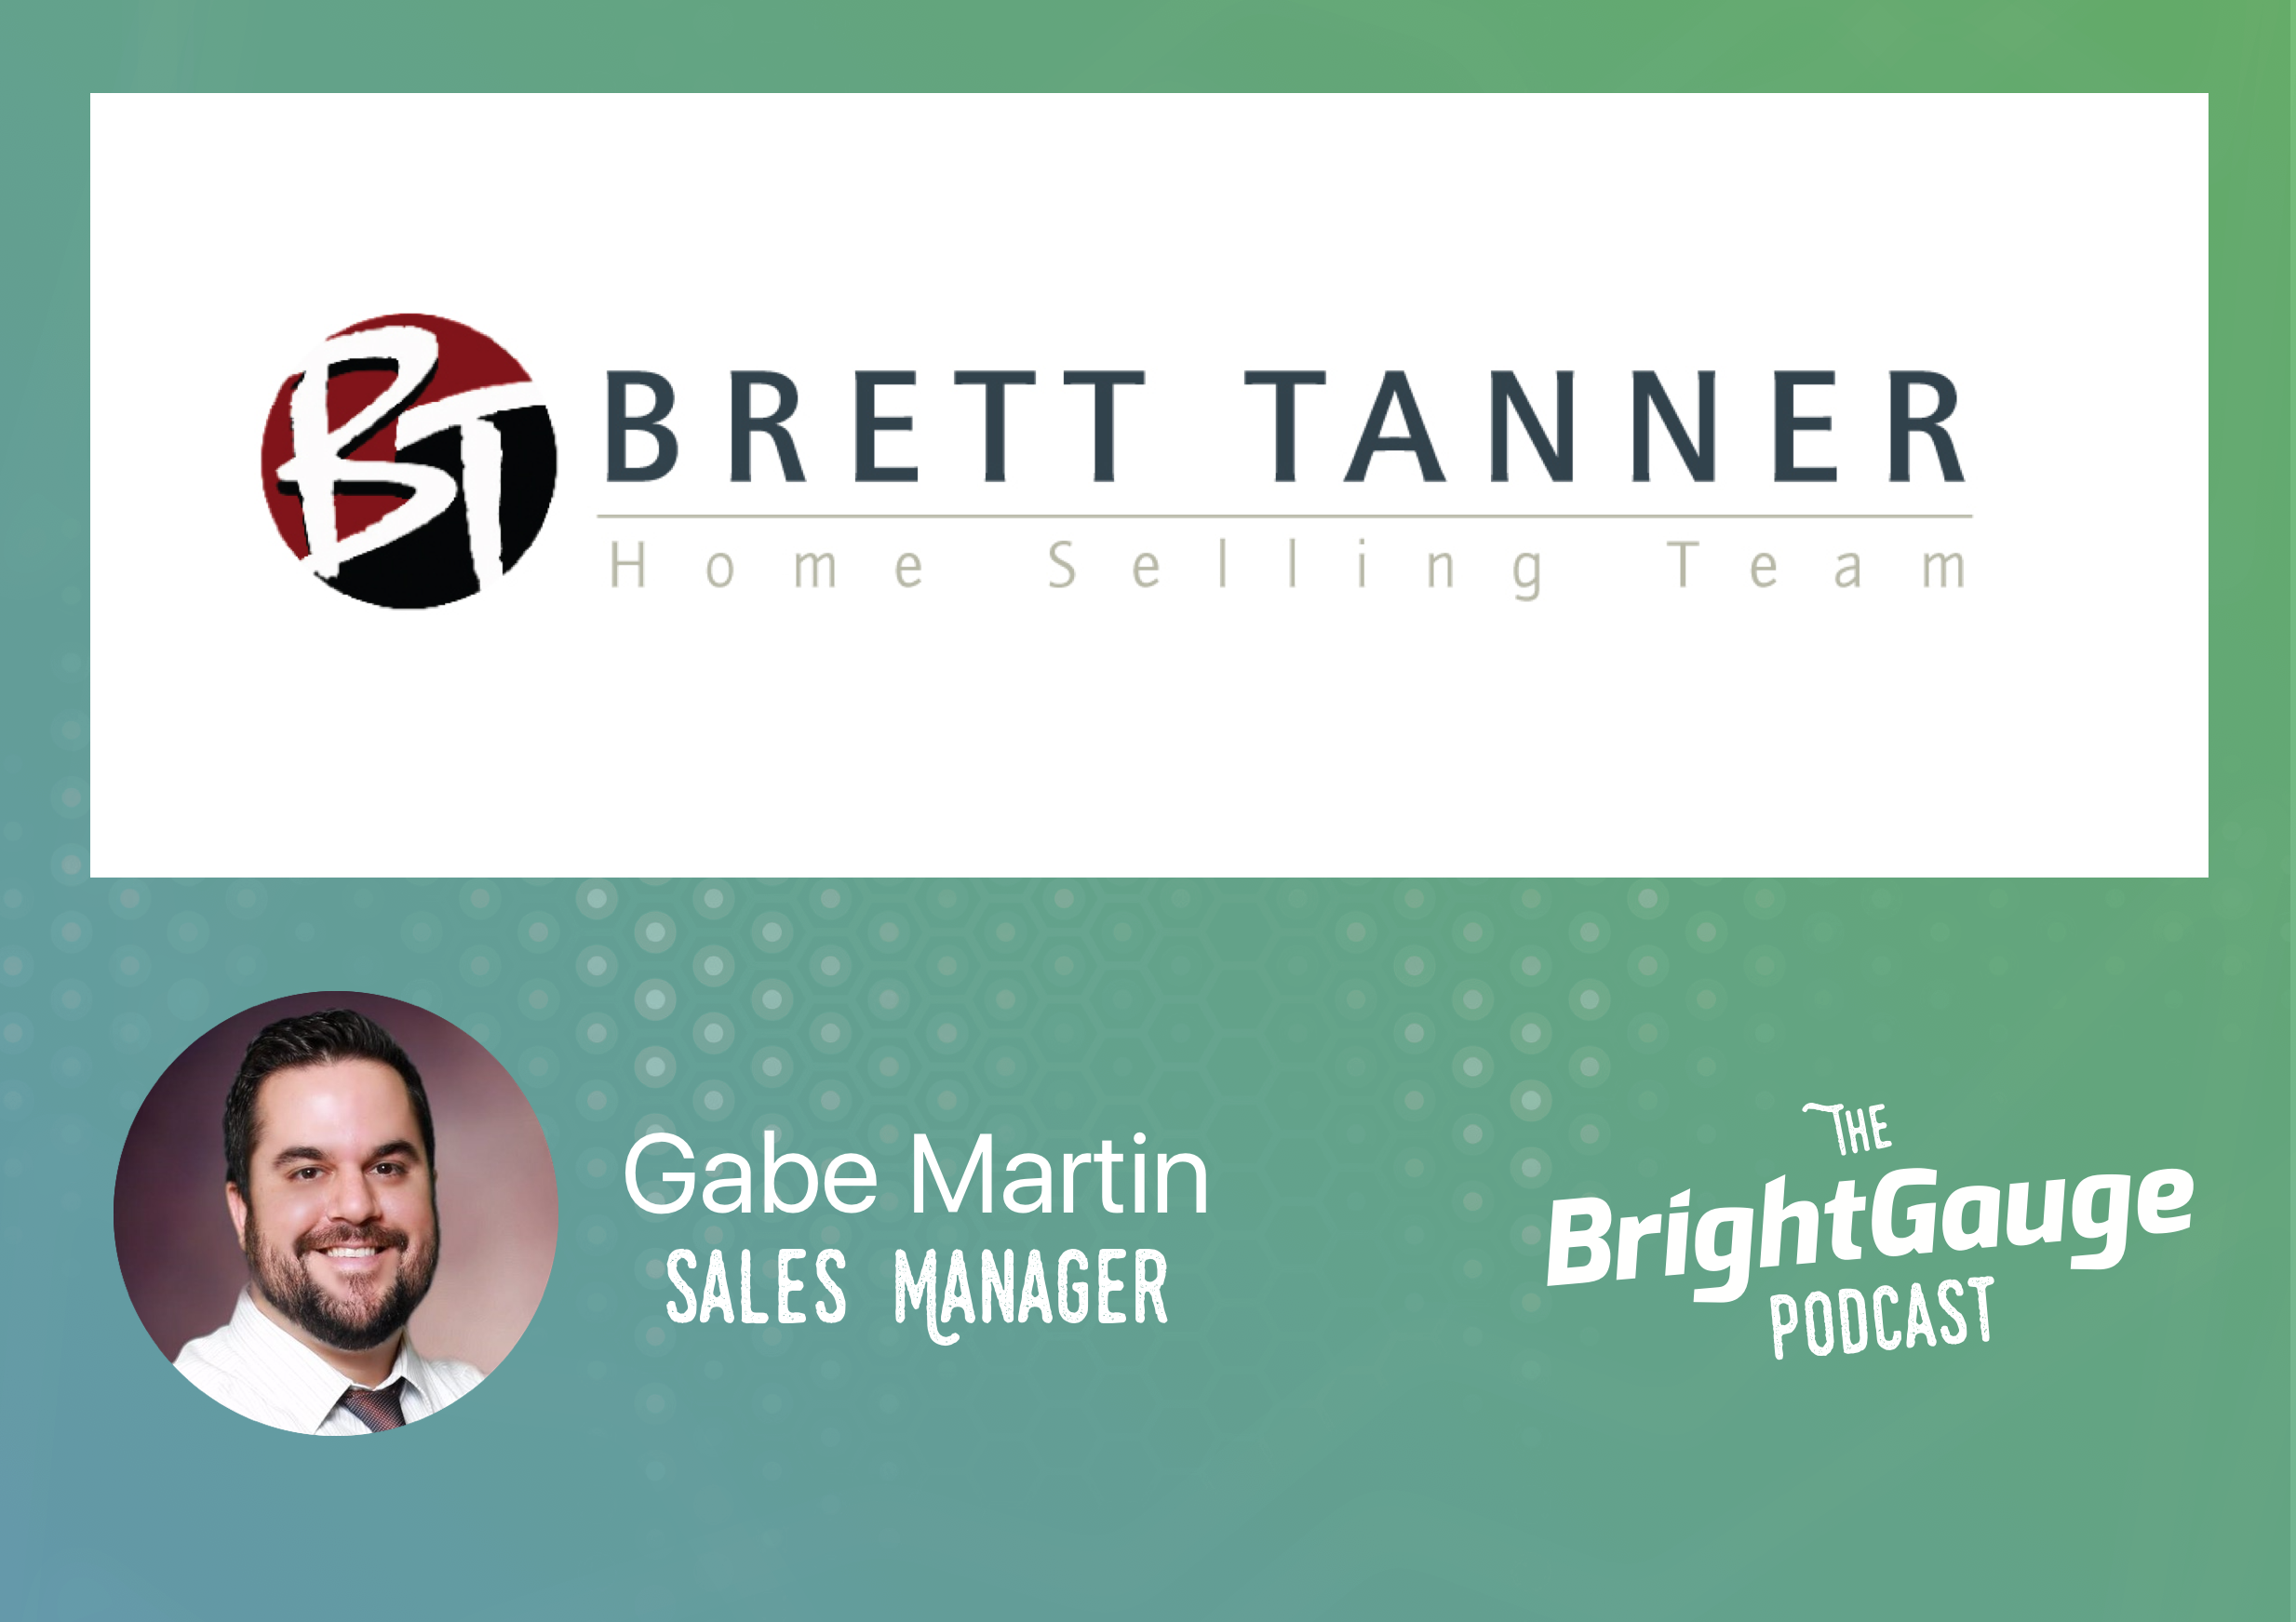
If you read the title of our latest episode, you may be wondering why a software company would be asking for advice from a real estate company, but the answer is simple. At BrightGauge, we often hear questions from our community asking for advice on building, managing, and growing sales teams… and almost everyone faces the same challenges no matter what line of business they’re in. We asked Gabe Martin to join us for a conversation based on his experience as Sales Manager for one of the highest-ranking residential real estate sales teams in the United States. Gabe has the answers to all the questions we hear so often: from recruiting based on personality types, to managing the day to day and weekly responsibilities, focusing the team’s efforts and much more. So whether you’re running a MSP or any other business, you’ll be able to gain some new insights and ideas about your own sales team. How to Find, Manage & Monitor a Sales Dream Team: Episode Highlights Gabe’s introduction and background (1:08) Why we invited a real-estate person to join our podcast (3:46) Gabe’s approach to the hiring process for sales people (4:33) The DISC personality profile (5:52) Next steps for personality matches (9:04) The best way to get a feel for who an interviewee really is (11:42) The numbers behind interviewing and hiring sales people (12:49) Managing the team day-to-day (13:47) The number of dials and contact rate in a 3-hour period (16:12) One-on-one meeting agenda (17:30) Remediation for team members who fall off track (23:47) Metrics Gabe tracks (24:51) Driving team competition (26:52) How to promote team bonding and camaraderie (29:27) The best business book and podcasts Gabe recommends (31:20) Resources that Gabe uses to get better every day (34:50) Parting advice for SMBs (36:20) As referenced in the episode: The Miracle Morning: The Not-So-Obvious Secret Guaranteed to Transform Your Life by Hal Elrod Want to find out more about The BrightGauge Podcast? Check out all the episodes here.
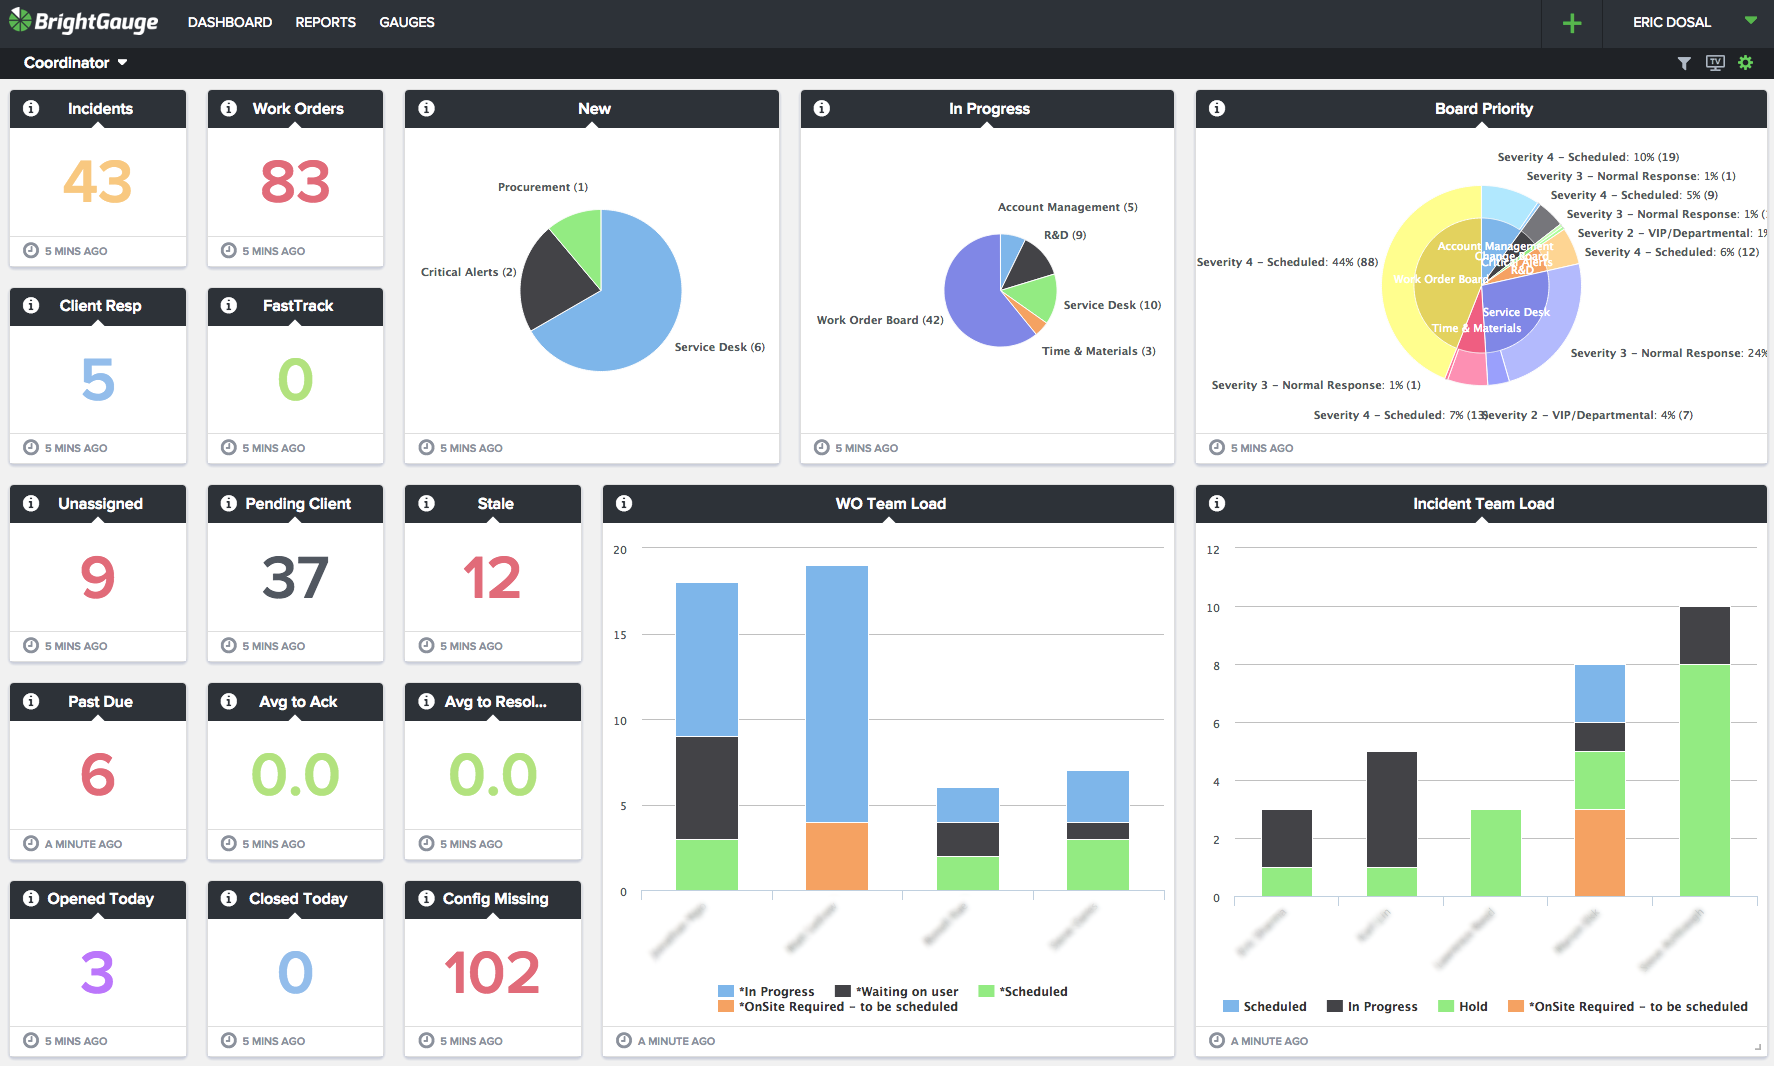
So much data, so little time. You hear about it a lot lately, in business publications, social media, maybe even in some of your company meetings... but what is data visualization, and why are so many companies now looking to jump on board with a visual solution? Businesses today are moving faster than ever, and running any successful company means making decisions that will best benefit the business in the long term. Hopefully those decisions are made using data instead of gut feelings, but data can present a problem of its own. Most companies have tons of data at their fingertips and running reports is not only time consuming, but it can also be overwhelming to compare trends in the data at hand. Take my own recent experience digging through a pile of information that I needed to sort quickly. I was working on some new marketing content with our CEO, Eric, when the conversation turned to the best channel we should use to reach our community. He asked me to pull the stats to show our most popular avenues - email, podcast, social media, etc. You may think this would be an easy task, considering we’re a data company and all, but like so many of you have probably experienced I hit the wall of what we call a data silo. Our marketing platform, HubSpot, unfortunately doesn’t offer much in the way of charts and dashboards (although we still love their product). So there I was, creating a list, exporting the data to CSV, and then importing the CSV into a spreadsheet so that I could make a nice pie chart to share with Eric. What a pain! Fortunately for me this time, I was only pulling the data behind one topic, or else this project could have taken ages. Why do visuals even matter? After the nightmare of all the shuffling from one software to another, it would be easy to lose sight of why making that pie chart was so important in the first place. Using graphic images or charts to present data isn’t just about a sweet-looking way to decorate your walls and represent numbers. It’s also the best way for a human brain to analyze and comprehend the numbers as seen before it. By placing data in a graphical form, the end user can easily understand the significance of the data before them, compare multiple pieces of data or even set goals and objectives based on the data. In fact, here are a few stats to help us explain just how important visuals are when it comes to interpreting data: The human brain can process entire images that the eye sees for as little as 13 milliseconds (source: MIT neuroscientists) About 80% of the information we take in is by eye (source: TED study on Visualizing Data) The human brain processes visuals 60,000 times faster than words (source: Dr. Lynell Burmark) But that’s not all. Data visualization is not only the fastest way to show data, it’s also a key factor in the impact and recollection factor. According to Forrester research, “When we hear a piece of information, we remember 10% of it three days later; if we add a picture, we remember 65% of it.” Now that’s a stat worth remembering! visualizing Service Coordinator results in dashboard form is the easiest and fastest way to comprehend the data When it comes to the best way that you can manage and grow your business, start by making sense of your data. Use a visual solution to translate trends into business intelligence that’s easy to understand, and if you have questions about how to better manage your data, reach out to our team to learn more.

Welcome back to Part 5 in our series on The People Behind the Product. If you missed blogs 1-4, the idea behind the theme is to help introduce the personalities that are working hard at BrightGauge HQ every day to continue building and growing the platform that we all love so much. So far we’ve covered our favorite movies, original hometowns, favorite places to eat, and treasured vacation spots. Now it’s time to talk athletics with a look at our number one sports! Steve: I'm not a massive sports fan but I watch a lot of soccer, mostly the English Premier League. The fans are really passionate and it's contagious. The build up that happens leading up to a goal is really exciting and once your team scores you can really get nuts. Eric: Baseball is my favorite sport growing up and I played all through college (#CollegeAthlete #HumbleBrag) but I've really enjoyed watching the World Cup and get into the games. So Soccer is quickly becoming my favorite sport to watch but that's only once every 4 years. Francisco: Soccer. Ever since I was 8, I have been playing soccer. Every time I play, I feel full of energy and hours can go by without me even realizing. David: Despite not being much of a sports fan I enjoy playing tennis. As a child I remember seeing a match on the television and telling my mother that I wanted to play it and she enrolled me in classes. It's a sport of finesse/control, endurance and quickness that's fun to play. Kristian: Basketball has always been my favorite sport since I was kid. It’s easy to coordinate a few friends and get a pickup game going and it’s a nonstop action sport to both play and watch. Football is definitely up on my list too, as watching College and NFL games is a weekly ritual in our household. While physically playing and coordinating football games is a bit more difficult, participating in Fantasy Football leagues is just as fun and competitive. Adam: Don't really play or watch much sports unless I'm with a group of friends who are already doing it. If I had to choose it would probably be basketball. Brian: Golf. It's a beautiful sport to play both visually in usually great open spaces but also what it commands in players. It commands mental control, risk management, and a strong sense of ethic. Amanda: I’m not into team sports at all (although I did win our BrightGauge 2015 Fantasy Football league… just sayin’ that’s a huge accomplishment considering I don’t keep up with sports). Do things like kayaking and whitewater rafting count here? If so, we’ll go with that. Oh and I want to try stand-up paddleboarding soon. Larry: Basketball. Both playing and watching it. Really fun sport to play recreationally, but can appreciate it being played at the collegiate or professional level. Rick: I don't enjoy sports. I enjoy rooting for your favorite team's nemesis. Orlando: Football for watching and Basketball for playing. I also enjoy playing softball but that's much harder to organize than basketball. Ryan: Soccer. I love watching (Chelsea FC and USA supporter) and playing. Played competitively since age 4. Randall: Basketball, both playing and watching. It's fast, which is perfect for watching, and because I like to play it, I can relate to what the players are doing. Do you see any of your favorites on the list? Tell us about your sports skills and what keeps you moving in your downtime!

70+ Metrics for MSPs
Key metrics and accompanying formulas to help MSPs skyrocket growth and success!
Get your KPIs
Do you ever wonder what everyone else is doing with their data? How they're leveraging it to help grow their business and keep their customers happy at the same time? Everyone loves a little dashboard inspiration, especially if it comes from a Power User. That's why we asked Shann Bosnell, VP of Technology at TUC Managed IT Solutions to lead a Show & Tell webinar with our community. He shared all the Best Practices his team uses every day to help manage the business. Topics covered during Shann’s presentation: How TUC uses data for their ITSM team Real-life examples of dashboards used by TUC's Sales Team The custom gauges that help TUC uncover sales opportunities across their client base and so much more! Shann’s BrightGauge tour is available on demand by clicking the image below:

Pre-BrightGauge Stephen Menendez grew up in the Miami area, a pretty common trend within our team of mostly-local talent. After graduating high school, Stephen set off for the Virgin Islands to study marine biology. He became a Certified Scuba Diver and not long after that, he realized that marine biology wasn’t his calling. So he packed up and headed back home along with a transfer to Florida International University where he kicked off his studies with Economics and International Relations. It wasn’t too long before Stephen’s dad convinced him that he should give the family business a shot in the textile industry. He commenced to packing and moving again, this time to New York where he enrolled in the Fashion Institute of Technology to study textiles. He took up a Sales position in the family business and interned at other textile-related companies; during the summers he would head off to the Dominican Republic to learn as much as possible about sewing garments, printing textiles and spinning yarn. It took 2 years, but Stephen decided that working for the family business was not a path that he wanted to take. He realized that Miami was calling him home and he was ready to pave his own road. After get settled in ‘the 305’ as it’s known, he completed his Bachelor’s in Economics and set out to forge his way in the career world. Welcome to BrightGauge Stephen heard about the opening for a Business Development Rep at BrightGauge, and while he was excited to apply, he tells us that it was his conversation with our CEO, Eric Dosal, that made him realize the opportunity was worth chasing. The discussion centered around the drive and spirit that shape our values, goals, and vision at BrightGauge and Stephen knew immediately that BrightGauge was the opportunity he was looking for. Plus, he loved the culture and the product passion that our team emphasizes so much. As Stephen explains, “not only is everyone passionate about what they are doing, but they are experts in their field and it is truly admirable.” As Business Development Rep, Stephen will play a key role in our SMarketing team, as the piece of the puzzle that will work with Marketing-qualified leads to turn them into leads who are ready for a product demo with Sales. From his own words, Stephen tells us that he’s excited about the opportunity to help grow the BrightGauge community and “crush sales”. After hours Outside of the office Stephen enjoys creating music. He’s been known to play the piano, drums, guitar, bass, and harmonica. We also hear Stephen has a passion for cooking and he likes to invite close friends over at least once a week to cook for them. We’re still waiting for a special BrightGauge team meal to try out his handiwork, but we feel confident that we’re going to enjoy every bite! Please join us in welcoming Stephen to team BrightGauge!
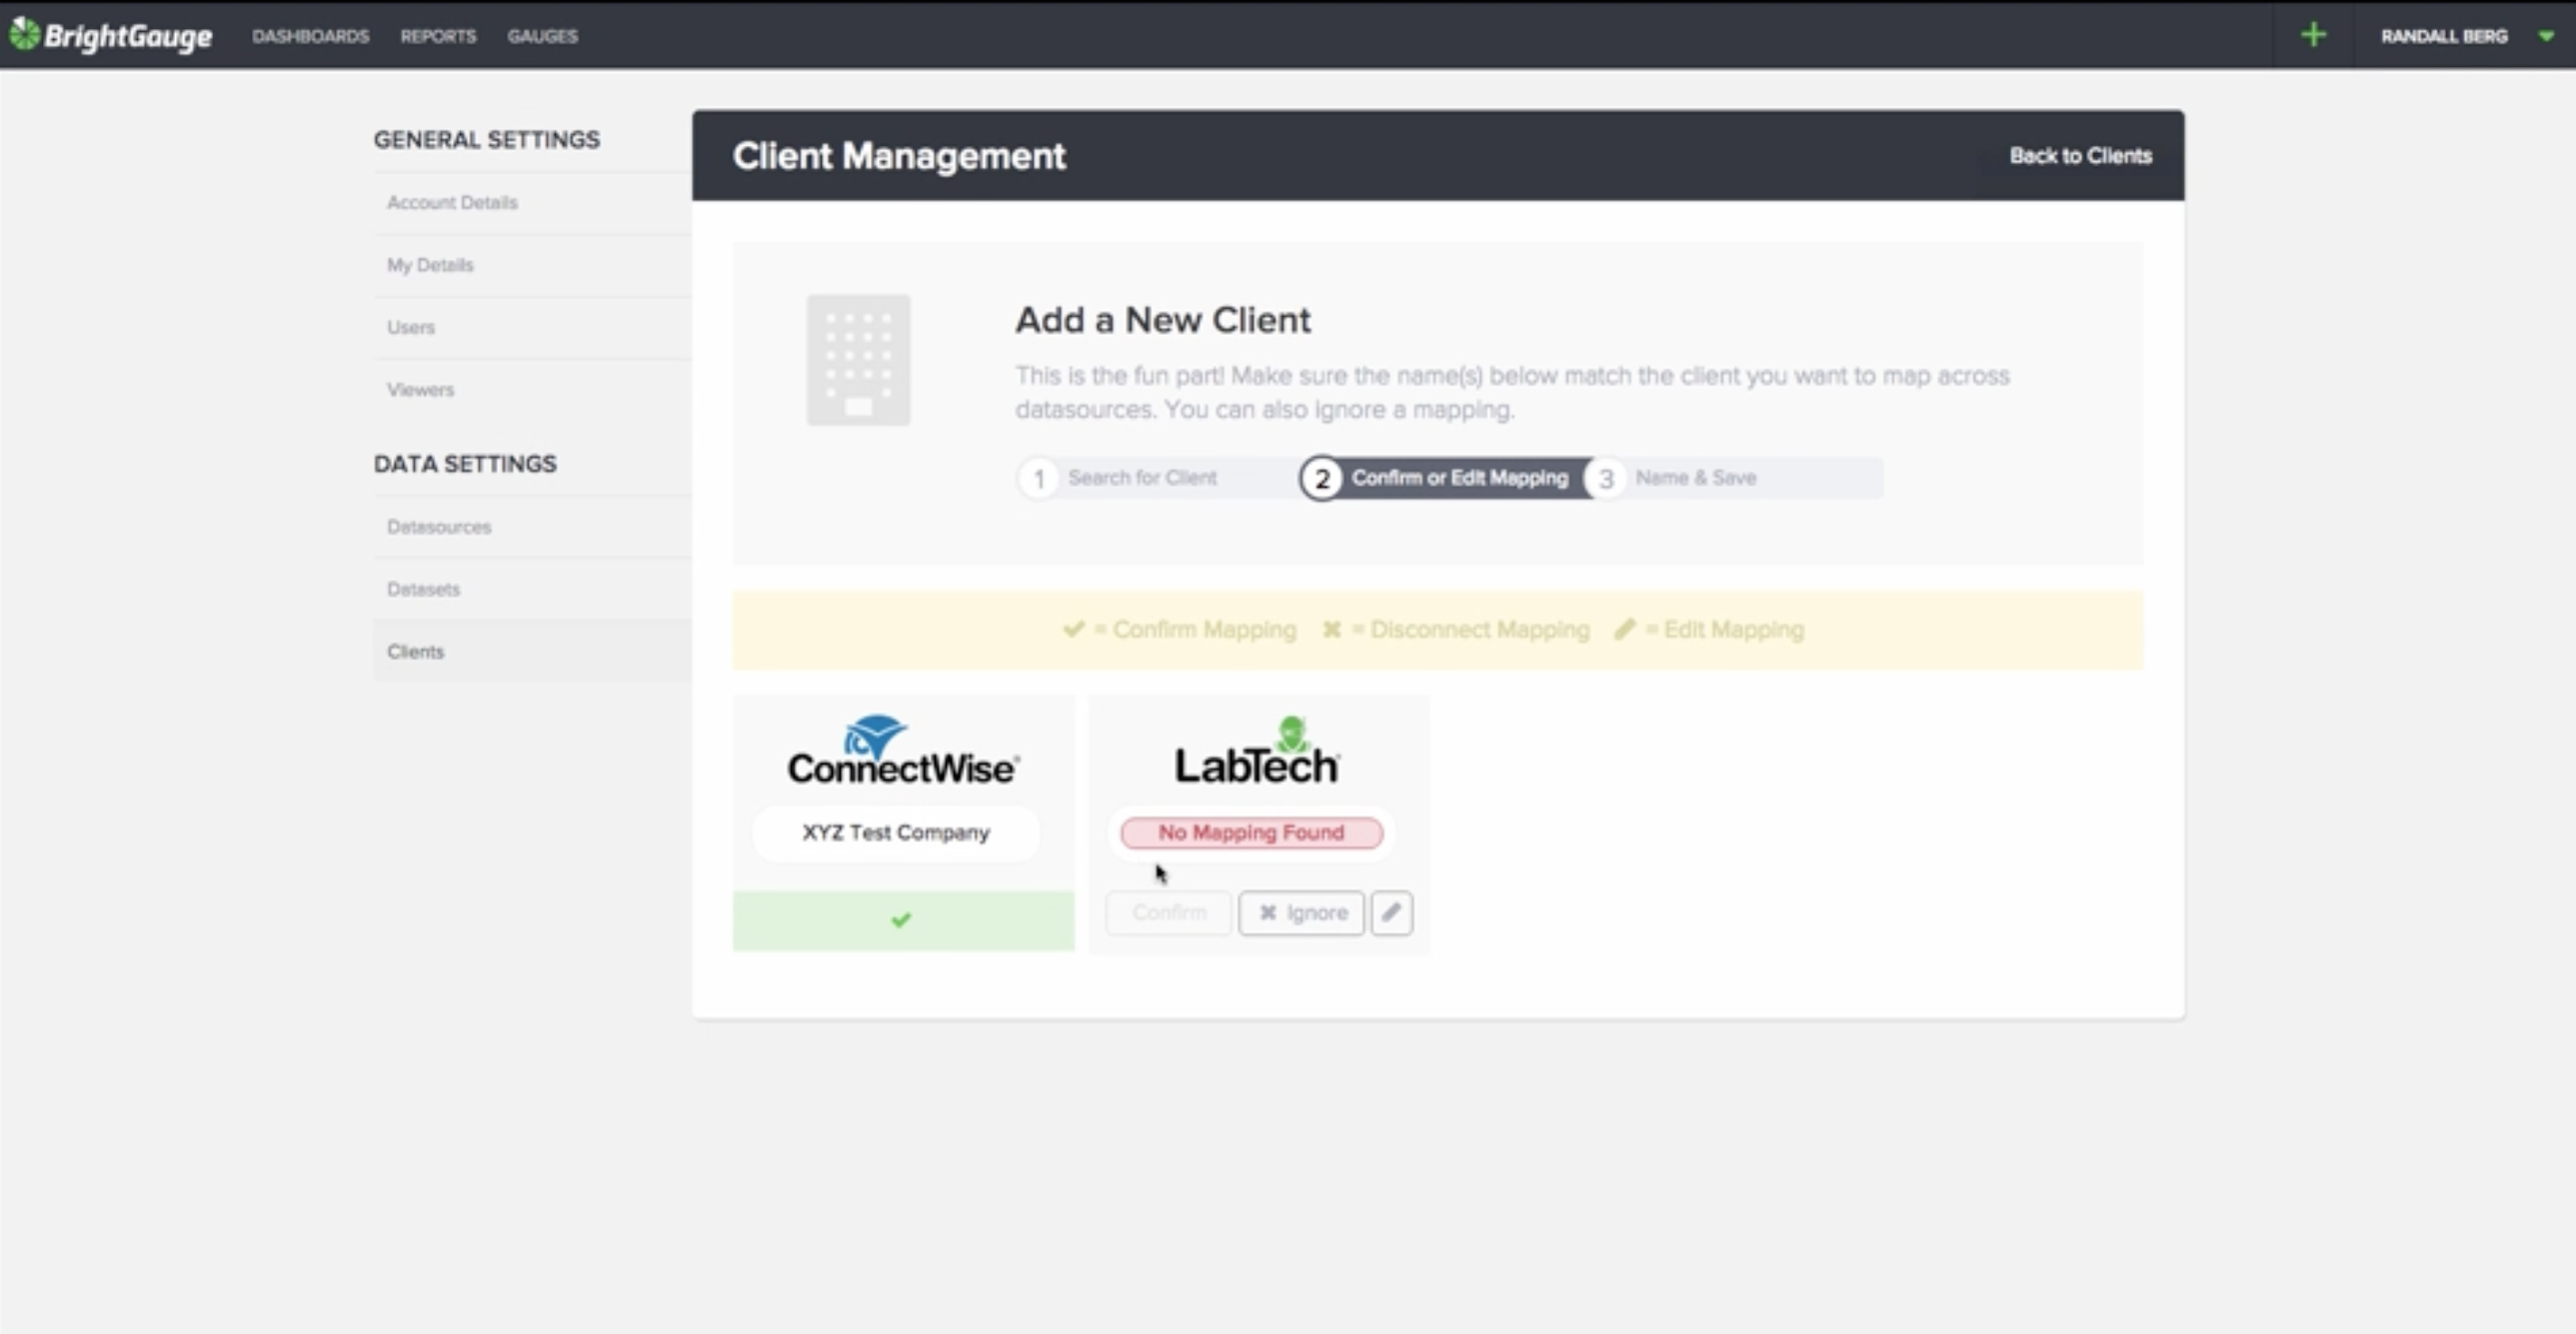
Anyone who has adopted a new software solution knows that there are always questions during those first few weeks. Or sometimes you’re looking for the answers before you agree to sign up. Either way, BrightGauge prides ourselves on making deployments easier than your typical software company! With that in mind, we typically hear some of the same questions from nearly every new customer we work with and we’re always happy to help point you in the right direction. But some of you are DIY’s (Do It Yourself-ers) and you want to fly solo while you tackle the implementation. If solo is your style, here’s the guide to our most popular onboarding questions: What is included with the Implementation Fee? We have a dedicated onboarding team that is purely focused on ensuring you get BrightGauge set up to the exact way you want to see your data. The implementation includes assistance with setting up the data source (including live online troubleshooting), weekly basic group training, one on one training as needed, any additional data customization you may need, how-to’s, or addressing any trouble you have connecting datasources. Can you build out my metrics for me? Of course we can! There are two ways to get this tackled: Take a look at our default datasets. Many of these will contain much of the same data that you were pulling in previously, just in a different format. If the data is there, then just build a gauge to reflect the data in the way you want to show it. You can also reach out to us on the Data Team to help you build those gauges. If the data is not contained in the default datasets, then you can take the SQL queries that you were using before and put them in BrightGauge. On your datasets page, you’ll see a “Create New Dataset” button and that’s where you can paste in your SQL query. If it’s an advanced SQL query, then there may be some issues, but our support forum contains documents that can help you format it or our support desk can help you with it too. Just send an email and we’ll be glad to assist. Do you do one-on-one onboarding training? Yes we do! However, we find it best to go through the basic group training before a one on one. The basic group training will start with a video class (small group webinar) and address the BrightGauge overview or 101 version. Then during on the One on One training we can dive into the specifics of your account and go over any customization needs specific to your company. Why is data inaccurate once I did my first full sync? When logging into BrightGauge for the first time, the data will likely appear inaccurate or higher than what you’re expecting to see. This is very common as all of our default gauges are built with base filters in place. The reason we do this is because everyone has a different set-up and if we were to account for anything specific, what may work for you will likely result in discrepancies for another. A big portion of the training is dedicated to showing you how to add these filters that are specific to your company. Once the gauges have been customized with filters, the data should match what you are expecting to see! If not, definitely reach out to our support team. How can I set up my Clients to get reports? - The process starts with creating Client Mappings within BrightGauge under the “Clients” tab. Client Mapping is a process in which you match your client’s names across all of your datasources in BrightGauge; for example, you may have a client labeled as Smith and Sons Transportation in your RMM, but in your PSA they may be labeled as Smith & Son Transportation. Mappings ensure that your reports are filtered for the correct client everytime, across all datasources. Apart from confirming the client names, when creating the mappings you also create your Client Recipients; these are the email addresses that will receive any report sent to each particular customer. For a more detailed outline of Client Reporting, feel free to refer to this short video. If someone new joins my team who will be in charge of BrightGauge, how do we get them up to speed? In this case, a new employee will start at the beginning of the training process just as any new account would go through. We understand teams grow and change, so our goal is to get new users up and running and comfortable with managing on their own. What happens if I have questions after my onboarding is complete? Questions are always welcome, no matter how long you’ve been a BrightGauge user! Our Support team is ready to answer any inquiries, and you can reach them at support [at] brightgauge [dot] com. Are you ready to get up and running now? If so, make sure you send us a photo of your accomplishments - we love to share under #BGSdashboard on Twitter.

Are you making the most out of the data at your fingertips? If you’re like most of our customers around the globe, then maybe you’ve caught yourself wondering what everyone else is doing with their BrightGauge. After all, viewing someone else’s work is sometimes the best way to inspire yourself to think outside the box when it comes to your own projects. Learn how to model the masters With this idea in mind, plus plenty of you asking to share ideas within the community we’re thrilled to share our first webinar that was hosted by a BrightGauge power user! Shann Bosnell, VP of Technology at TUC Managed IT Solutions joined us recently as he led a show and tell of sorts filled with custom gauges, dashboards, and insights on all the best practices you need to know. The webinar was originally a live event, but you can still access the full recording using the link below. Some of the topics Shann covered: Learn how TUC uses data for their ITSM team See real-life examples of dashboards used by TUC’s Sales Team Walk through some of the custom gauges that help TUC uncover sales opportunities across their client base and so much more! Access the webinar recording here:

We’re thrilled to congratulate our Co-Founder and CEO, Eric Dosal, on his 3-year BrightGauge anniversary! While he's been a part of our story from the first concept to today, this milestone is significant because it marks his move to join our team full-time and the rest, as they say, is history... In the Beginning Eric grew up in the Miami area where he spent summers working for the family IT business, Compuquip Technologies. Back in those days he started at the bottom, spending his days carrying technician tool boxes and pulling cables, all for $3.75 an hour. When the time came to get ready for college, Eric decided on Babson College because he knew he wanted to study business and there was also a great opportunity to play on the school’s baseball team. After graduating, Eric went on to follow his finance passion and pursued his dream of working on Wall Street. But as most of these stories go, the reality wasn’t nearly as glamorous as the dream. Eric had been working 90+ hours a week for over 2 years when he decided that this life was not his calling. Back home in Miami, his father offered a sales position in the family business and Eric ultimately decided to take that opportunity. He worked his way up the management ranks and after 10 years accepted the position of CEO of all the companies under the Dosal Capital umbrella. During that time Eric worked with his brother, Brian, to start the Managed Services division of Compuquip and ended up growing the group from $800K in annual revenue to $8.8MM within a 5-year period. The brothers decided to sell the Managed Services group so that they could focus on a wild idea Brian had: to build a software product. The Wild Idea Comes to Life With a background in the IT business, Eric and Brian immediately recognized what they wanted to accomplish with the software. At the same time, they also knew that founding a business was an incredible opportunity for each of them to focus on their own strengths while building the company and supporting each other. They decided to split responsibilities and Eric would get started on building the BrightGauge sales process and inbound marketing program while Brian would focus on the software development. As the company reached 6, 8, and now 15 employees, the brothers decided to officially split the company into two teams in 2015, Growth and Product, so that each employee could focus on their area of expertise instead of everyone doing a little bit of everything. As the head of the Growth Team, Eric is responsible for Marketing, Sales, Implementations, Customer Success, Support, and the most recent addition of the Data Customization crew. As he explains it, he loves running the team because he has “a real passion for SMarketing” (combination of Sales & Marketing). To top it all off, Eric also adds executive responsibilities and Finance too. Outside BrightGauge When he’s not leading our fearless Growth Team, Eric splits his time managing 2 of the other 3 family businesses as President & CEO of Compuquip Cybersecurity and President of Dosal Capital. We’re not sure how he juggles it all, but Eric also plays a big part in the business leadership community in the Miami area as an Executive Committee member of the Young President’s Organization (YPO) and also the Co-Chair of their Forum Group. If you were starting to think he’s all business, think again! Eric loves spending his free time with his family: daughters Isabella (4) and Andrea (1 ½) and his amazing wife, Lorena. They keep him busy enjoying fun time outside of work hours! Eric's family time with Isabella, Andrea, and Lorena Please join us in congratulating Eric on an incredible 3-year journey with the BrightGauge team; we can't wait to see what the next chapter holds for our team!
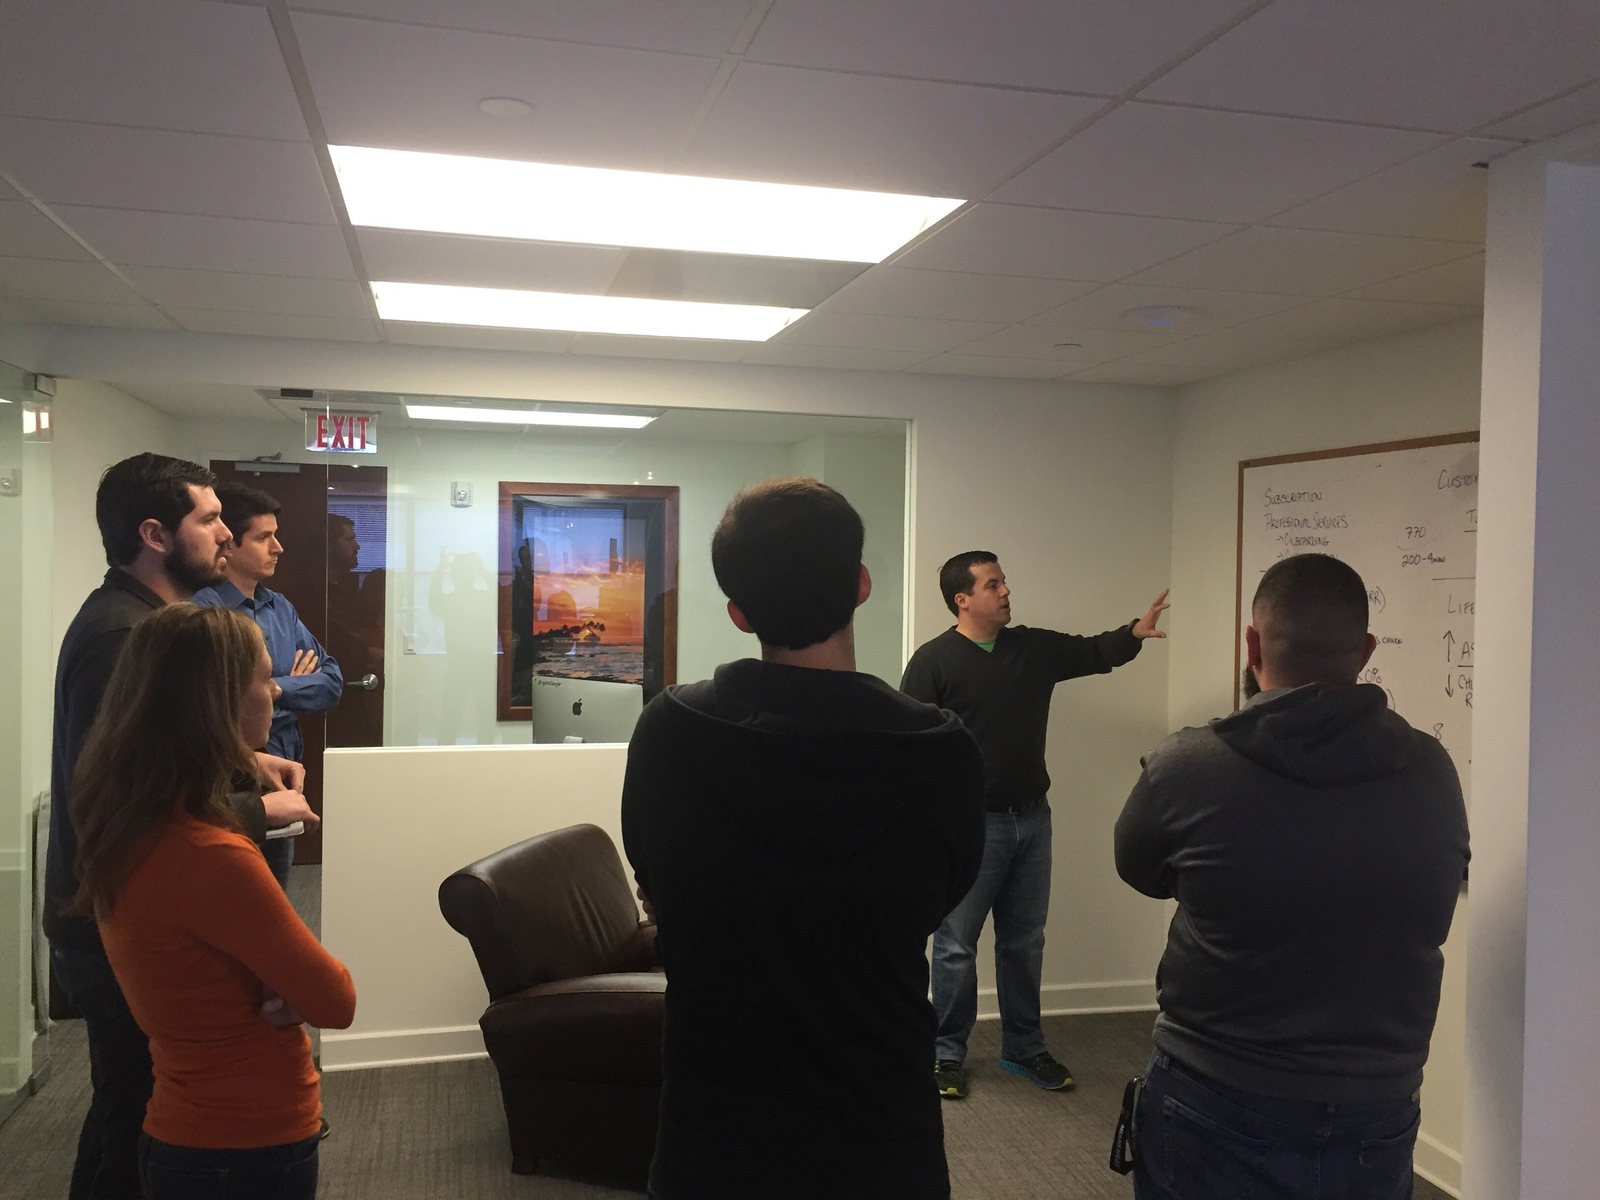
There’s a lot of excitement when it comes to being part of a team that’s rapidly growing. There are new skills brought to the group, new personalities added to the mix, and you see accomplishments stacking up faster than ever. But growth comes with some challenges also, and over the last year our team has been right in the middle of the excitement and the obstacles. A year is a relatively short amount of time for a team to almost double in size, and one of the big differences for our group was trying to keep up with effective communication. Yes, we talk to each other constantly as a result of a very open floor plan in our office, plus we have lunch together most days, and there are always Slack messages being traded. While those are all great ways to have a quick chat, we still needed a way to make sure that within the Growth team every individual stays up to date on all of the pieces that make up the larger puzzle, so to speak. One of the best ways we’ve found to keep everyone in the loop are weekly stand-up meetings. Every Monday morning, our team gathers in a circle to share a quick (15-20 minute) update about everything going on in Marketing, Sales, Customer Success, Data Customization, Support, and an Executive update as well. Eric leads a stand-up discussion on analytics How to host stand-ups First things first: we’re serious about keeping these sessions at a minimal amount of time so that we’re finding the right balance between increasing communication without taking away from our productivity. To help ensure that the session stays quick, each team member is required to update their notes on a shared Google Doc prior to the start of the meeting. This way, we breeze through and nobody has to stop and think about what they need to say. There are 3 topics that make for a successful stand-up: Recap of accomplishments the prior week: The key here is to highlight a few tasks that are not part of your regular weekly routine. For example, as Marketing Coordinator I wouldn’t tell the rest of the Growth Team that I completed a few blogs during the week because that’s a given. I could instead talk about the changes made to an email layout that increased click through rate by X% because it’s a special project, plus measurables are always a great thing to share when possible. Focus for this week: Again, make sure the plans you talk about for this week are not part of your ongoing weekly functions. This is your opportunity to reference some of the special work you’re focusing on that will be a step towards completing a big picture project. Obstacles that are impeding progress (especially ones that may need team help to conquer): Some weeks you’ll find that you don’t have any obstacles to mention, and that’s fine. However, let’s say I’m working on a blog that needs some data from a specific gauge and the data doesn’t appear to be correct. I would mention this during stand-up time because it gives a heads up to the Data Customization team that I’ll need a few minutes of their time to get the data sorted before I can finish my task. a sample of the topics covered at a recent standup If your team is in need of a fresh take on keeping everyone in the loop, give stand-ups a try. We really enjoy the opportunity to have a quick group discussion on the big picture items and also understand what our counterparts are working on each week. Plus, if you find that you need updates more often, take a page from our Product Team’s playbook... they host a standup every morning!
