Blog Logo-2.svg

The BrightGauge Blog

Brian Dosal

MSP Industry is Doing Great… Am I Right?

For the past 7-10 years we’ve been hearing that the MSP industry is going to be disrupted by Google and Microsoft cloud services. In fact, even a current customer came to our office the other day ...
For the past 7-10 years we’ve been hearing that the MSP industry is going to be disrupted by Google and Microsoft cloud services. In fact, even a current customer came to our office the other day saying he is worried about the future of the industry yet he’s grown 25% YoY for the past 5 years (>$2MM revenue to start). At this point I think it’s fair to say that the industry is healthy, growing, but also as a whole has a terrible paranoia about the future. Anecdotally we hear this constantly even as we meet hundreds of new MSPs entering the market each year who are looking to us for a data platform, or we meet the smartest MSPs who are dropping over 20% in EBITDA constantly every year with $5MM + in revenue. Another way to look at it is how much M&A money is flowing into software vendors such as Autotask, N-Able, LogicNow, Kaseya, etc. Private Equity and acquisitions with great multiples means smart people are betting on MSPs growing and seemingly their bets have paid off as more investments keep on pouring in. This is a very encouraging sign on top of our anecdotal evidence with our personal experience. All in all I think it goes back to technology support (in whatever form) for small business will always be needed as technology is ever changing. The only constant of technology is change. And as long as there are small to medium sized businesses then there will be need for MSPs. We may not be featured in TechCrunch but I believe many of us will take cash flow over hype any day of the week! If you want to learn about how our customers are growing, request a demo with BrightGauge today. We help IT Services companies (MSPs) become more data driven with our powerful data platform. You’ll learn how we feel the right Dashboards, Custom Reporting, and Scorecards in one easy to use platform will help any company grow!
request-a-brightgauge-demo

Product Notes: Scorecards Jumpstart 2017

During our annual planning session we spent a good hour on our leadership scorecard. Below I wanted to share my thoughts about the process and the scorecards feature in general. Something is better than nothing BrightGauge scorecards are great for weekly tracking of KPIs to keep your business in line with your goals. Yes, we did tie our scorecards to the EOS model but you don’t have to follow EOS to leverage the value. Here’s how you get started: pick 7 KPIs that tell the story of your IT Services firm (MSP) each week and pick a weekly target for each one. Something like: Cash Balance > 100K Response Time <30 Sales Quotes Delivered > 5 Collections > 50K CSAT > 98% Kill Rate > 100% Projects Currently Open > 5 Assign each one of these an owner who is on your leadership team or who truly owns each one of these. Then during your weekly meetings with that same group (which I’m sure you have them), go around the room and make sure everyone has their number checked in. That’s it. That’s how we got started and we let it evolve from there. You can always adjust targets, change KPIs, or add some later, but for now you just want to get started. For more in depth Best Practices on using data to drive growth, watch this webinar. Cadence & Accountability Scorecards are useless without a cadence. You have to be meeting and checking in with them weekly. This is not a passive feature where you sit back and look at the numbers. This is an active engagement of committing as a team that the numbers are accurate and that you are holding yourselves accountable for making an impact on these numbers. MSPs are huge data nerds, and we love it, but this is about looking into each others eyes and knowing each of your team members is owning their numbers. Especially our Connectwise customers, that datasource is so data rich but we all need to realize it's more than just the data that matters, it's how you use it and who’s accountable for the right numbers. We have lots to do with Scorecards We’re going to keep the beta tag on so you feel comfortable giving feedback (its amazing how that tag works). Scorecards mean different things to our IT Services customers (MSPs) and we understand that so don’t think you’re crazy! Feedback like Engineer Scorecards, Benchmarking, Sales Scorecards have all been floated to us and we’re working on some cool stuff based on that feedback. So please keep sending ideas our way. In fact, just in our annual offsite my brother Eric identified about 5 features that we want ourselves. 😃 Learn more about the tactics that have helped drive growth at BrightGauge, for our customers, and at our MSP:

Subscribe to get the latest content delivered to your inbox

What is a Product Team, and What are They Responsible For?

My brother mentioned that at BrightGauge we have two teams, one being the Growth Team (which he manages) and the other being the Product Team which is my responsibility. Though we all work very closely together, there are very distinct differences between the two teams. As you can imagine, our product team has complete responsibility for building and maintaining... you guessed it... our product. The different functions that make up our product team are fairly well known in the software world but may not be to people outside the industry. So I’ll lay them out for you now: Product Manager: makes sure that all engineering and design work is getting done properly and with thoughtful order. This one is my personal responsibility and you can also think of this role as the “project manager”. In building agile software products, the role expands a bit more where the responsibility is making sure the team is building the right features, at the right time, and in the right order. Seems simple but I can assure this has yet to become a science. Other fun responsibilities of the Product Manager is to be the top quality assurance tester so as to make sure what is put in the pipeline to be developed and shipped does so at the acceptance levels we all would expect. User Experience (UX) / User Interface (UI): This critical role builds the human interfaces and interactions within the platform… better explained as this person makes sure BrightGauge is user-friendly. In any product team, this skill is one of the hardest to find because of the wildly broad expertise needed; it’s not just being a good artist or coming up with good ideas but it’s both of those as well the implementation of those ideas. It’s a blend of right brain and left brain thinking that very few individuals possess all together. And that’s not to mention the attention to the finest details in actually delivering that idea which needs to be something beautiful and incredibly useful. It’s a critical part of any product team and we are no different. Back End Developers / Engineers / Architects: This group loves to turn ideas into living products; the code they write is running the most critical parts of our product. The core of any software product is the architecture which can be translated into the systematic design and technologies used to run the product. This is where back end engineers live and for us this is the background of our Director of Engineering. I, and many others, call this area the “backend” because the code they write does not interface directly with the user. This function, especially with small teams like ours, also compromises development operations, which means they are responsible for keeping systems up 100% of time. Thankfully, services like Amazon Web Services take care of a lot of that system administration and network security, so the backend team can focus more on writing code instead of maintaining servers. Front End Engineers: differentiated from the backend because these specialists know how to work with technology that is very browser focused (for web apps like ours). It was once explained to me that the code being used to create amazing web experiences is like the wild, wild west. Where technology and approaches are so varied and changes constantly that we, like many others, need specialist who just live in and love this world. It’s not to say these same engineers couldn’t or don’t do backend work (or vice versa) but it’s more a division of expertise. the Product team enjoying a lunch celebration To close, I must also say that we thoughtfully named ourselves the product team versus what would be a traditional development or engineering team. The reason we call ourselves a “product” team is that every one of us works together to build a full product that adds real value to our customers. This means we aren’t just a group of engineers writing code to write code, or a designer trying create pretty designs. We are a cohesive team with many different specialties but have a singular goal of building an amazingly useful product for our customers.

Don't Let Your Ticket Categories Get Stale!

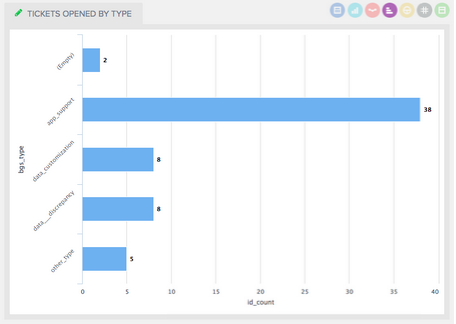
Last week we decided to move the BrightGauge Support function back under the Product Team (under my wild command). We did this for one obvious reason...I want to hear feedback as quickly as possible about the product so we can make quick improvements to fix issues and reduce friction. Thankfully our users are REALLY good at providing feedback and asking questions through support so this should work out really well for everyone. When I took over this function I quickly realized the way we were categorizing tickets (using Ticket Types and Ticket Sub Types) wasn’t providing any actionable insights. We have our support dashboard up on a large TV in our office and when I would walk by I couldn’t get a quick understanding of where we’re having the most issues or friction in the product. By Wednesday morning I changed the type categories into 4 new ones that made the most sense to me and were very simple. They were App Support, Data Customization, Data Discrepancy, and Other. The first two are broad types so that I could segregate tickets between things the dev team needs to investigate (App Support) versus our Implementation and Data team (Data Customization). To be clear, being a business intelligence product for small business, we receive lots of requests to customize our default datasets or expose more data from our customer datasources. Typically those are small billable projects or just one-off easy changes, but to me they are not “product issues” that our developers need to worry about. The two other categories of Other and Data Discrepancy were my attempts to further reduce the noise and find product issues and friction. We receive lots of tickets similar to “My data doesn’t look right” which we call Data Discrepancies and typically these are simple questions or changes needed in the customer datasource. Again, not really product problems but more data specific to that business. I’m not sure this Data Discrepancy Type will stay at a top level as it could be under “App Support” but for now, I’m keeping it as I know I can always iterate on this later. Lastly, the Other category is just a catch all for crazy unrelated tickets. Every once in a while we get a ticket that was meant to be forwarded to some other company, etc. We don’t want to delete these, just categorize them at the top level and filter them out for our reporting. After three days, here’s what our chart looked like on the board: As you can see quickly, a majority of tickets coming in are App Support. That’s perfect and is exactly what I was trying to segment but now we need another level of categorization... SUBTYPES! Before I go on though, take a look at the “Empty” column. There are 2 tickets in there that need to be categorized. One of things I love about using BrightGauge for own internal use is the easy ability to drilldown into that bar and get the ticket numbers. I have this dashboard up on my second monitor throughout the day and I’m able to quickly tell our support team to make sure they are categorizing everything correctly. We have some new support team members so these are great coaching moments that I can catch nearly live. Ok, lets talk subtypes now. Again, based on my own intuition I came up with sub types for the App Support type that I think will provide me the best insight right now. I kept it simple because I know I can always iterate and create new ones...but I also don’t want 100’s of categories... that would be way too much noise. Here’s what those subtypes look like in a pie chart. The Subtypes I started with are Feature Requests, Billing, Syncing, Questions, and Issues. Really, I could have just started with Features, Questions, and Issues but I know from talking with customers and seeing the flow of tickets recently that we’re having a fair amount of questions around Syncing and Billing. So I carved those out as separate subtypes to review separately and figure out our plan of attack. As you can see above, after 3 days there is a decent spread among the 4 categories which means my subtypes are solid! After another week of data flows into these charts, we’ll sit down as a Support and Dev Team together and drill into each of these sections to figure out what other trends (besides billing and syncing) are emerging. For instance, are there constant Feature Requests that are being asked through support? Maybe we tackle those quickly. We’ll be able to quickly tell by drilling down into this pie chart and reviewing the subjects of these tickets (which we rename constantly so its easy to understand the feature from the subject). All of this work to re-categorize our tickets took just a few minutes and will be a work in progress over the coming weeks. The one lesson I learned from all of this is that categorizations can easily get stale and once that happens, the metrics and charts will start to be ignored by you and by the team. I also realized that it’s ok to iterate on these categorizations as things constantly change. Our new support dashboard is working really well internally as I see our team stopping and looking at them every day. Thats what dashboards are supposed to do, they are supposed to change the behavior of the people watching them nearly in real time. Iterating and improving your categorization through new types and subtypes are low hanging fruit to make sure everyone is on the same page with what’s going on in your support organization. It certainly was for us.

What We Learned At DataStax Tech Day

We recently attended the DataStax Tech Days for Apache Cassandra at the JW Marriott here in Miami. The seminar was hosted by Rob Murphy, Solutions Engineer at DataStax. If you are not familiar with DataStax they provide big data solutions using Apache Cassandra along with other technologies to some of the leading tech companies in the world. Cassandra, is an open source NoSQL database system that was originally created by Facebook back in 2008. At BrightGauge, we use Cassandra as one of our backend database solutions. Though we are very happy with what Cassandra provides us today, we wanted to learn about how to take more advantage of its feature sets. So far Cassandra has not required much maintenance and has worked out of the box as advertised. For this reason, we went to this session to figure out what else we can throw at it! Rob Murphy gave an introduction to Cassandra. He gave a high level overview of how Cassandra works, how it differs from a traditional RDBMS and its tunable consistency feature. One of the biggest hurdles when using Cassandra, is understanding the data model for storing and retrieving data. Rob did a great job of using real world examples to show how data should be modeled for efficiency in Cassandra. We also got to take a look at some of the software DataStax has created to work with Cassandra. Their OpsCenter and DevCenter applications, make interacting with and managing Cassandra a breeze. This was followed by a tour of the DataStax Enterprise feature set, which was quite impressive. Robbie Strickland, Software Development Manager at the Weather Channel, then presented examples of how Cassandra solves a lot of the data problems that they encounter on a massive scale. The Weather Channel pulls in vast amounts of data from a variety of different sources (puts our data requirements in perspective). They have used Cassandra in very creative ways. For instance, they are currently using it as a cache instead of the “out of the box” memcache which he said has drastically increased the speed that they can get their data into their users hands. The Weather Channel also leverages Cassandra’s tunable writes to handle floods of location data inserts. They receive constant updates from the 100M users that are currently using their mobile apps. The insights he shared opened our minds to the continuing possibilities of using the technology in different aspects of our software. The day session was fantastic and confirmed some base assumptions we’ve made and tested thus far in our architecture. And ultimately, Cassandra is one less headache within an advanced technology stack that we have at BrightGauge. That, and Cassandra’s speed, makes this database solution the most attractive NoSQL solution for our small team!! Thanks DataStax for the session!

70+ Metrics for MSPs

Key metrics and accompanying formulas to help MSPs skyrocket growth and success!

Get your KPIs

Gartner Business Intelligence & Analytics Conference Recap

Last month, my brother and I attended Gartner's Business Intelligence and Analytics Summit in Las Vegas. For those unfamiliar, Gartner is a large and well respected American information technology (IT) research and advisory firm, and they publish the Annual Gartner Magic Quadrant Reports. These reports rank each company in every product or sub-industry within the IT business community. Since many companies, especially enterprise companies, rely on these reports when selecting vendors and making technology decisions, the reports serve as a "Who's Who" in the industry. BrightGauge is a newcomer in the Business Intelligence (BI) vendor space and we felt there was no better time to attend a conference like this than in our early years as a BI platform. The conference did not disappoint. It was a tremendous learning experience about what enterprise customers are looking for in BI solutions and what vendors who focus on enterprise customers are building into their platforms and solutions. Here were my three takeaways from the conference: Everyone wants to make data driven decisions. I mean everyone. From enterprises, to small business, to consumers, all our customers want to understand and interpret their data in order to determine the most meaningful answers to their challenges. Although getting a Google or Siri in front of everyone's business data is still years away, that is the ultimate goal. Investments are being made so this becomes easier for everyone. Traditionally, enterprise companies depend upon their IT departments to help define what type and what volume of data is needed to make good business decisions. The new model begins to eliminate the IT or BI department from the equation of decision making. Investments are being made in order to equip business users with the tools they need to visualize their data and create the metrics they need to monitor their business activities. Today's businesses are not really large enough to support true BI departments, but they are sophisticated enough to manage their own data with a little direction. Data is Everywhere. Spreadsheets, sale numbers, in house customer service information and social media sites all contribute to the volume of data companies create every day. Each of these systems have their own reporting and dashboard functionality, but when not viewed together, this information creates an incomplete picture and profile. The BI industry helps companies consolidate, visualize, and take action on ALL their data. Fortunately we also learned that at BrightGauge, we have and are currently building all the main pieces needed for an Enterprise Business Intelligence solution. This provides us great confidence that our market, the Fortune 1,000,000, will be able to leverage the Enterprise class features and functionality we are building. Which will help make our customers as competitive as they need to be in order to compete in their markets. A true win, win for everyone!

BrightGauge in 2014: Simple & Powerful

Since we launched in late 2011, our solution has gone through many twists, turns and grown quite rapidly in features and value to our customers. All the changes and enhancements made during the last two years were critical when delivered which is normal for any new software product going through its early market fit stage. At the start of this year though, we have over 1,000 users from all over the globe creating dashboards, gauges, and reports and in all honesty we have over complicated certain areas of our platform. Therefore, the product team and I have committed to focus on two main goals: Dramatically improve user experience Deliver powerful analytical solutions through new feature sets With these goals in mind, we are first taking a deep look at our product and curating any features that don’t provide a tremendous amount of value to our company’s mission. That mission (which has been curated itself over the past year) is to help small and medium sized businesses make better and faster decisions through the easy analysis of their own data. It has not been an easy task to review our product in this light because everything we built into our product had a specific purpose when we developed it and released it. The reality though is that we know it’s best to focus on our mission and not try to be everything to everyone. This ultimately means we have to make tough decisions to remove certain features that a subset of our customer base may find useful. The good news is for 90% of our users, there no be no impact with the exception of an improved user interface and speed gains! For the 10% impacted, we will work with them directly to help transition away from certain features and offer alternative solutions. The first two legacy features on our plate to curate and improve is the IT Health Score and Client Portal. Both these features tie into each other and have been around since we launched in November 2011. Over the coming weeks, we will be removing certain parts of this functionality while delivering the same value in a different manner. We will work directly with the user base that uses these features regularly and will provide a detailed update on our game plan. We will continue to focus on simple and powerful functionality and will announce them in the coming weeks and months. What I can tell you now is Business Intelligence solutions for IT Service Providers will not be easier and more powerful than with BrightGauge in 2014!

Security and Infrastructure

Given that our customers are primarily in the IT Services market and that we are integrating with on premise databases, we constantly get asked the two questions: How does BrightGauge handle security? What impact does a BrightGauge agent (for on premise connections) have on customer servers. I want to answer both of these questions and elaborate a bit more for our community: For starters, we take security extremely serious starting with our management team down to implementation. In fact, being part of the Dosal Capital family of companies, one of our sister companies is a cybersecurity firm, Compuquip Cybersecurity. Security is in our DNA from the start and we are constantly looking to improve our controls (as everyone knows, security is an ongoing battle). Data Ingestion and the BrightGauge Agent Typically, the meat of the security conversation starts with Data Ingestion (how data goes from a customer site to BrightGauge). The reality is we need to get data securely and efficiently from our customers databases. We accomplish this by having developed our own Agent that customers download and install anywhere on their internal network. This agent exists to do two things only, 1) take SQL queries from BrightGauge and query the database locally to grab data quickly and 2) encrypt that data and send back to BrightGauge on a regular interval. The agent creates a secure SSL Tunnel between itself and our web servers. In order to further protect the connectivity, we ask our customers to open up a port in the firewall (of their choosing) and lock it down to our IP Addresses (which we only provide when someone is a customer). Once a customer locks down that port using our IPs on their firewall, then we are set on having a secure channel to communicate the encrypted data through. What Data is in Transit The agent is extremely light weight since it’s only passing queries and encrypting data. The SQL queries being sent to the agent (and therefore database) are purely up to the customer... but of course many choose to use our Default Datasets per data source (SQL queries). These default datasets/queries refresh data on a regular interval and because of that refresh, data is never STORED on BrightGauge servers for more than that pre-set interval time. From an efficiency standpoint, these default queries have been tested with customers all over the world of all sizes and haven’t caused any performance issues to date. If a query starts to deliver too much data, our systems reject the query and stop connectivity before the request could cause any issues with the database themselves. Now that we have answered the efficiency of the queries and the security aspect of Data Ingestion, we can turn our attention to our own infrastructure. BrightGauge Infrastructure At the outset of starting BrightGauge, we decided to focus on what we were good at as a team, developing software. Therefore, we made the decision to host all our infrastructure, physical controls, and network security with Rackspace. Rackspace has an army of network security professionals that monitor and manage our entire infrastructure 24/7 from their data centers (read about Rackspace Security Certifications here). With our infrastructure in a Private Cloud (with a small subset of servers in the public cloud) we rely happily on the experts at Rackspace to keep us monitored and secure. Fortunately, we were able to choose the highest level of security services from Rackspace including being protected by leading edge firewalls and Intrusion Prevention Systems (IPS). Data Storage Our databases (we use two types of databases) are extremely well protected and like I mentioned above, never store data for longer than the regular data refresh cycles. The data being refreshed is always visible to the customer and default datasets can be added or removed at the discretion of the customer. Many folks ask what type of data we refresh in our default dataset but that changes. It all depends on what data is required to create beautiful reports and metrics. As we continue to grow our customer base and infrastructure, security is top of mind and we continue to invest time, money, and energy into making our environment first class in security and reliability.

Job Opening: Software Support Specialist

(Please note: This position has been filled as of June 1, 2015) BrightGauge, founded in 2010, is a SaaS based Business Analytics Software Platform based in Coral Gables, FL and San Francisco, CA that focuses on the worldwide Managed Services and IT Services industry. After growing from zero customers to several hundred customers across 6 continents in just one year, BrightGauge is looking to hire a full time Software Support expert to help support its fast growing user base. This role primarily entails working directly with BrightGauge customers from all over the world to handle support questions (both technical and non-technical) and handle consulting engagements. This position will report directly to one of the Co-Founders and will provide room for development growth as the 8 person BrightGauge team grows!! Requirements: An interest in web application software platforms and technology in general Passion for good customer service Very reliable and caring for customer’s success Knowledge of MS-SQL and MySQL Databases and ability to write queries. Strong written communication skills. Ability to have a great time at work. Nice to haves: Interest in programming languages like Python or PHP Knowledge of HTML/CSS Humor (well a good sense of one) Position Details You will work with awesome people every day and an even better customer base. Full time position with salary and full benefits (medical, 401K, etc) Hours of operation 8:30am -5:30pm EST though off hours work to support worldwide market will be a regular occurrence Cover letters must be included with all resumes and be submitted to info@brightgauge.com

Launching BrightGauge Implementation & Customization Services

Today marks the official launch of BrightGauge Consulting, a new set of services we’re offering our customers to help them get the most of out of their PSA & RMM data. Over the past few years we’ve delivered consulting services on an ad hoc basis but after talking with our key customers, it was apparent that a formal set of services was needed to help our community maximize the value of their data with BrightGauge. What is available from our consulting team? Implementation Services - If you sign up for BrightGauge and want us to lead the setup effort, we can do so at a very cost effective rate. We’ll lead calls with your internal team, do dedicated training, and setup your first few reports & custom gauges. JumpStarts - Many clients just need a quick jump start with some custom metrics built within our Gauge Builder and Reports Scheduled to their team. We can take in your high level requirements and quickly build metrics that we know we will drive value for your business. Custom Fields Delivery - Many MSPs have unique KPIs or unique User Defined Fields that are not within the standard BrightGauge datasets. We can help you build those fields with custom SQL queries or a custom API calls from your cloud based Data Source. Who’s doing the Consulting? What’s really great about our experienced team is we have the MSP industry expertise to know exactly what you’re looking for in just a few short conversations. Between myself (Brian Dosal) and my brother Eric Dosal, we can help refine your requirements and help you define the scope of work. Next, our talented technical team has over 2 years of experience working with our current Connectwise, Kaseya, and LabTech databases as well as the AutoTask, Connectwise, and Kaseya. This makes our consulting work efficient pack a big punch in a short period of time. Should you need Business Process Consulting, we can introduce you to one of our consulting partners who specializes in making sure your processes and systems match up to the KPIs you require. How to engage with BrightGauge Consulting? First, you must be a current BrightGauge customer in order to work in a consulting engagement. Next, just send an email to support [at] brightgauge [dot] com with your interest and we will work with you to define your scope and price your engagement.

Measures, Dimensions & More

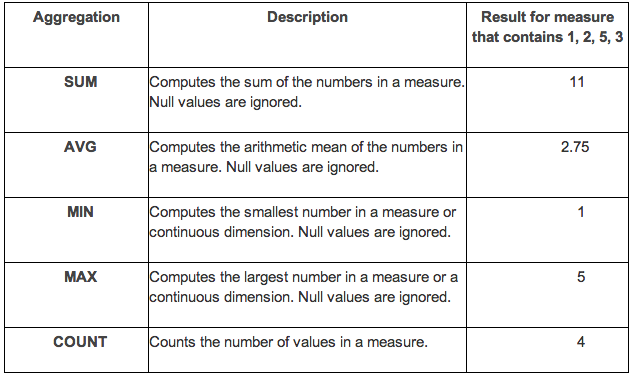
Our new Custom Gauge Builder in our 3.0 Release brings a lot of power to “slice & dice” data easily and intuitively. To achieve our goals of simplicity and much utility, we have introduced some standard data visualization terms and functions which we describe below: Measures A measure is a value that is aggregated from an existing raw field within your dataset (count of tickets, average time to resolution, total revenue... these are all measures). In the context of data visualization, measures typically map to the Y axis of a chart. Measures also typically refer to quantitative data, such as number of tickets opened, average time to respond, utilization rates, etc. For instance, you might calculate the Average Response Time per day over 90 Days. In this case, the Response Time field is your measure because you want to get the average response time across the date range you selected (which brings us to Dimensions). Dimensions Dimensions are the slicing and dicing of a Measure. They usually refer to categorical data, such as engineer name, ticket status, or even units of time (i.e. day, week, month). Generally, dimensions are used to group quantitative data (measures) into useful categories (i.e. number of tickets closed by engineer). These fields typically map to the X axis in a line chart or vertical bar chart. In the example above about Average Response Time Per Day Over 90 Days, the 90 days is your Dimension. And for a non date range graph like “Tickets Closed by Engineer”, the Engineer is your dimension since you are trying to Measure the # of Tickets Closed against that dimension. Aggregation Functions Aggregation functions within BrightGauge perform a calculation on a set of values you have selected and result in a single value. For example, a measure that contains the values 2, 5, 4, 1, 6 aggregated as a SUM results in a single value: 18. How this applies to a bar chart using (PSA as a datasource for example) is as follows. If you have 100 Service Tickets from 25 End Users in your data source, you probably want to view the total number of Service Tickets created by each End User so that you can decide which End Users are opening up the most Service Tickets. In this example, you would select Service Ticket IDs as your Measure and apply the COUNT Aggregation Function. And you would select the End User field as a Dimension so you can view the Count of Service tickets per End User. BrightGauge provides a set of predefined aggregations that are shown in the table below: Filters Filtering is very important within the BrightGauge Gauge Builder. Depending on the field type you will be allowed to do different styles of filter. To learn more about how BrightGauge can help you with your data visualization needs you can request a demo with our team.

Our Latest Content

// Siteimprove tracking