Blog Logo-2.svg

The BrightGauge Blog

Eric Dosal

4 Ways Transparency and Dashboards Go Hand in Hand

Businesses and the leaders within them are using the phrase “need to know” less and instead are beginning to embrace an “everyone should know” mentality. In other words, businesses are adopting the ...
Businesses and the leaders within them are using the phrase “need to know” less and instead are beginning to embrace an “everyone should know” mentality. In other words, businesses are adopting the idea of transparency at a rapid pace. There are many reasons as to why transparency has become such a big deal, but one of the largest reasons is the ability to change behavior both in your staff and your customers. If you’re not fully sold on the importance of transparency in business here are a few vital statistics: Transparency increases customer satisfaction by close to 20% (according to an HBR study) It also increases employee efficiency by 13% or more (according to the same HBR study) Transparency is the top factor in determining employee happiness (according to a Tinypulse study) These benefits have led many businesses to look for ways to increase transparency. We often hear from our customers that one of the main benefits to using dashboards is the increase in transparency that they easily provide. Dashboards are one of the best ways to display metrics for tracking performance, and there’s no hiding from those numbers. If something isn’t going well, it shows, and that transparency will help your team to work together to address the issue. The data speaks for itself and creates transparency without a large amount of effort from management. Here are the top 4 reasons our customers love to use dashboards to increase transparency: 1. Your team will be on the same page An important benefit of increased transparency in a company is the ability to ensure your team is working together and with a shared vision. Studies show that when teams are on the same page they feel more confident, put more effort into their work and deliver more predictable work. In order to achieve those benefits, you’ll need to help get them there. You could take the time to meet every day and ensure that everyone is on the same page, but that requires a large portion of time from you and your team. A better way to do this is to put dashboards up around the office on computer or TV monitors. This will result in a quick and easy way to ensure your entire team knows what’s going on and can keep an eye on important metrics. In this scenario, you’ll want to place some of your KPIs on a dashboard in a place where your team can be instantly informed as they walk by. 2. You will align everyone with certain metrics to improve Part of being transparent is keeping your team in the loop and sharing with them key metrics even when the numbers aren’t pretty. One of the benefits of being so open about your business’s metrics is that your team will know when there is a particular area of the business that needs extra attention and will be able to use the data to determine which methods are working and which aren’t. It's proven that tracking key metrics and sharing them will increase the performance of your team when done on a long-term and regular basis. Whether you share in the form of a weekly report or you keep a monitor/TV on at all times for the team to see, you’ll receive great benefits from constantly tracking the metrics that matter most to your operations. 3. You’ll celebrate victories together When you display your data on a dashboard for all to see, you allow your team to know when they have improved a metric. Seeing an objective finally achieved creates a great boost in company morale and brings your team closer together. Think about the last time you worked towards a combined sales goal or customer satisfaction goal and you hit it. Surely you felt a great deal of accomplishment when you knew that you had achieved success in that area! Making your metric transparent and available to everyone not only allows them to experience the same feeling of accomplishment, but it also results in everyone working hard to achieve the goal. 4. You create a little friendly competition In some cases, such as a customer service or sales environment, you can create a little healthy competition by putting everyone’s performance numbers up. This transparency allows team members to see how they compare to their peers and often results in an increase in performance. Our new leaderboard gauge was designed just for this and is a great example of how a dashboard can be used to create competition. You do need to be careful not to create too much competition, but with a little creativity, you can display individual performance numbers while creating team based competition. When creating competition, keep in mind that you want your team to be working together to hit a metric, not working against each other. How we use dashboards at BrightGauge HQ Since we are a dashboard company, it only makes sense that we use dashboards all over our office, and the benefits like an increase in our team’s efficiency, are invaluable. We track all of our customer support work on dashboards and display those on TV monitors around the office so that we can easily see how many tickets are open and also what phase they are in. This allows us to immediately see where we stand and helps to keep the team all on one page. It also helps to shed light on which areas we need to dedicate more resources and time to by aligning the team with metrics to improve. Because the dashboards are up for all to see, we can celebrate when we’ve hit an important metric and it also creates a little bit of competition when our team sees who’s leading in a certain metric. Conclusion Remember, transparency is a powerful tool to change employee behavior, customer interactions and ultimately your company’s bottom line. The easiest and most effective way to increase your transparency around the workplace is to use dashboards to display key metrics. Dashboards are helpful because they: Get everyone on the same page Align your team with key metrics to improve Boost morale when victories are achieved Create a little healthy competition See the other great ways dashboards can be used by checking out the BrightGauge Dashboardery.
request-a-brightgauge-demo

How Air-IT Stays a Step Ahead of the Competition with BrightGauge

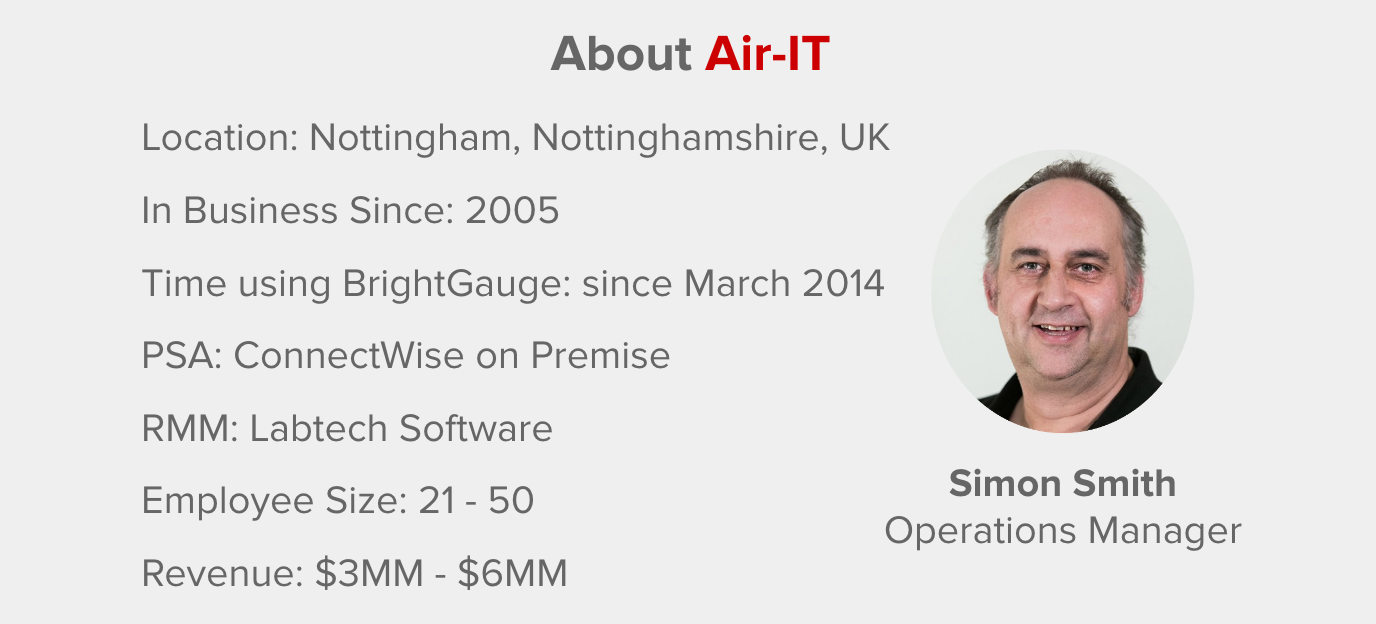
[Case Study] Air-IT had been using another dashboard and reporting solution, lots of manual coding and “liberal doses” of Excel. They found that it was difficult to obtain accurate information and ensure information was based on the correct criteria. They also struggled to present the information to the team in a brief way and create reports that showed clients they were getting value for their money - without breaching confidentiality. Air-IT Operations Manager, Simon Smith, knew that getting accurate information in a timely manner was necessary to streamline their process and identify areas with the potential for improvement. Transparency is very important to Air-IT and Simon realized that in order to move the business forward, he would need to find a way to obtain and present accurate information in a way that didn’t take ages to compile. Adopting BrightGauge Simon believes in giving things a try before making a decision, so he began with a number of BI tools. BrightGauge came out on top after a process of “survival of the fittest”. Another reason Simon chose BrightGauge was because the helpfulness and responsiveness of our team. Simon says “Great support makes a lot of difference when it comes to getting the most from a tool.” Implementing BrightGauge and going through the onboarding process was “very easy” for Simon, and the number of gauges that were usable from the get go made it easy to get meaningful and accurate information. “If you know what you want to see, you can get started right away”, he adds. Simon also gives praise for BrightGauge’s support team, calling the support excellent, responsive and accurate. There hasn’t been a single issue yet that wasn’t completely resolved and he’s happy about the fact that he doesn’t have to wait weeks to get a response. Data customization was incredibly easy for Air-IT with graphs, tables and counts that could be customized with a simple drag and drop. Using the prebuilt gauges and default datasets, Simon has been able to pull some unique information out without needing to be a SQL programming expert. It’s been incredibly productive for him. Measurable Results Armed with real time information, Air-IT was able to immediately put themselves ahead of their competitors by delivering higher levels of customer service and satisfaction while increasing their profitability. According to Simon, “The best thing of all is that we we’re able to measure the effectiveness of our strategy and know it worked for us and our clients: a win-win!” In one example, Air-IT monitored the categorization of reactive tickets, and they were able to identify the issues which were the source of the most support calls, leading to a standardized solution: The management team at Air-IT have demanding requirements for performance information, so the ability to create dashboards with incredible ease that also show information in real time, and showcase more than one type of graph in reports was a big deal for Simon. As he explains: “We can see where the business is at pretty much in real time – this is information that takes competitors days to work out, and most of the time they don’t bother.” Recommending BrightGauge According to Simon, BrightGauge can be a game changer for both your operations and your strategy, but you’ve got to allow it to do that. It can be scary to put your real time numbers up for everyone to see, especially because those numbers are often sub par (when seeing them for the first time). Simon says that you’ve got to be honest with your team and yourself about the performance of the technical side of your business.

Subscribe to get the latest content delivered to your inbox

The Top 5 Objections to our QuickBooks Integration

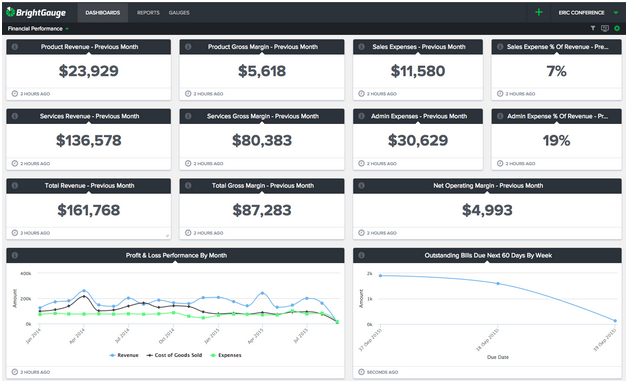
Up until the end of 2015 BrightGauge was primarily focused on operational and sales metrics. But as our customer base grew we saw a demand for more and more financial metrics. Some of them were in our customers’ PSA (Connectwise, Autotask, and TigerPaw) but we realized not all of it was. That’s why we decided to work on an integration with QuickBooks Desktop. With this change we have received a lot of questions and objections from our customers that we wanted to address: Objection #1 - Security Concerns About Financial Data Let me start out by saying that I believe operational data (customer name, phone number, location, service history, asset count, etc.) is more sensitive than how your team accounts for the revenue and expenses. That being said, we take security very seriously because it’s in our blood. Our sister company (and our oldest operating company in our family business) is an IT Security Provider, Compuquip Technologies. Both my brother and I came from Compuquip and continue to be involved with the business to this day. So security is always top of mind regardless of what type of data. You can learn more about our Current State of Security and also check out our Security Policies. Objection #2 - QuickBooks Reporting is handled by the Finance Team We can totally appreciate that each team has their areas of responsibility and understand that the finance team may want to keep QuickBooks data out of the hands of their operational team. That’s one of the reasons why we have built in User Permissions into our Advanced Plan allowing the administrators of the account to control who can see what information. For a complete list of the types of users we offer and the permissions please visit: BrightGauge Users Explained Objection #3 - What’s the benefit of real time financial reporting in BrightGauge? Do you have a real time pulse on your company’s financial performance? Or do you wait until several days after the end of the month and get a PDF report emailed to you from your finance team or bookkeeper with your P&L... when it’s too late to make adjustments to performance? Over 90% of businesses only review financials on a monthly basis with the most popular report being their Profit & Loss statement. The problem with waiting until month end is it might be too late to course correct your business, but by having the information earlier you can make the changes in real time based on the trends you’re seeing. Objection #4 - I don’t see why I need QuickBooks metrics We all know cash flow is the oxygen of any business and without it you cannot survive. Knowing it's this important, why wait for someone to run a report for you and send it to you each week or worse yet, each month. Why not have the information in real time being shared with all the key team members that can help collect. These types of metrics will impact your cash flow immediately and easily pay for the investment in the integration. Objection #5 - We already have a QuickBooks reporting solution and don't want to switch This one makes the most sense and we know how difficult it is to make a change to a new business intelligence tool or reporting tool. That’s why we pride ourselves in Crushing the Learning Curve but don’t take our word for it, hear it from a new customer that recently went through the experience: Priority One Makes the Change to BrightGauge. Financial data brings a unique context into your organization so when you combine it with Operational data the result is true, valuable insights into the overall health of your business. See how having the right reports and dashboards at your fingertips can help you achieve your business goals:

3 Key Metrics to Improve Cashflow with Real Time Information

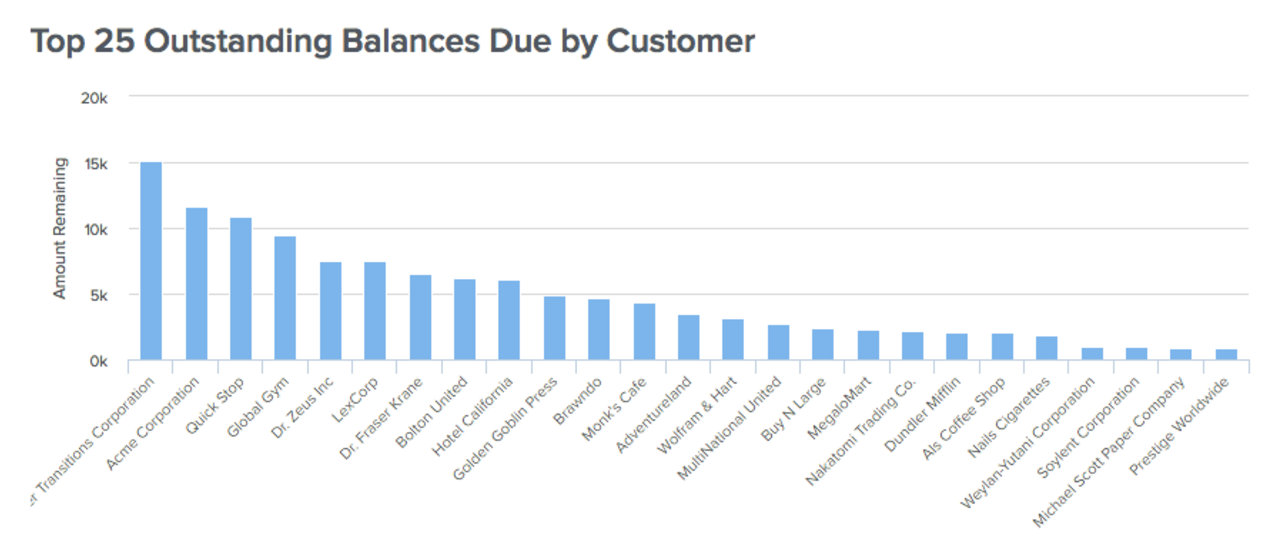
If you are like most IT Service Providers you rely on your monthly Profit & Loss Statements (P&L) to do a deep dive into your financials but P&Ls are usually delivered a few days after month end. The problem with this approach is the potential negative impact to your cash flow from having too many invoices outstanding. But rather than having to wait until the end of the month you can now have access to these key metrics in real time. Here are a few of our most popular gauges relating to Accounts Receivables and how you can leverage them within your business. A simple visual like the one above gives you a quick snapshot into which customers have the largest outstanding balances across your entire customer base. Typically your largest customers have the largest outstanding balance, however, by understanding the total amount and how it compares to others is important to make sure it’s not over weighted to any one particular customer. And when you target your invoice collection follow up you can start with the ones that will make the biggest impact. See how easy it is to keep Accounts Receivable data at your fingertips Another popular view for Accounts Receivable is to break them up by amount of time past due to see which customers are the biggest violators of your terms. The goal should be to keep as much as possible current, meaning they are still within their terms of payment. However, just about any business will still have a lagging payment here and there and using an Aging Detail report will allow you to quickly spot any problem customers that might have slipped and are now past due. Now that you know which customers are past due and what their balances are, it’s easy to follow up with your customers to get paid. With our Outstanding Invoices Details you can quickly see each individual invoice that’s outstanding and all the necessary details about each to properly follow up. Cash is the oxygen of any business and understanding where your outstanding balances are is a critical metric to track on a regular basis. Remember that “regular basis” doesn’t mean waiting until the end of the month because then it might be too late to make the changes that will impact your bottom line. Instead, by leveraging our QuickBooks Desktop integration you’re able to see this information in real time and deliver to the appropriate team member to follow up.

How Managing by Exception helps to Simplify Your Dashboard

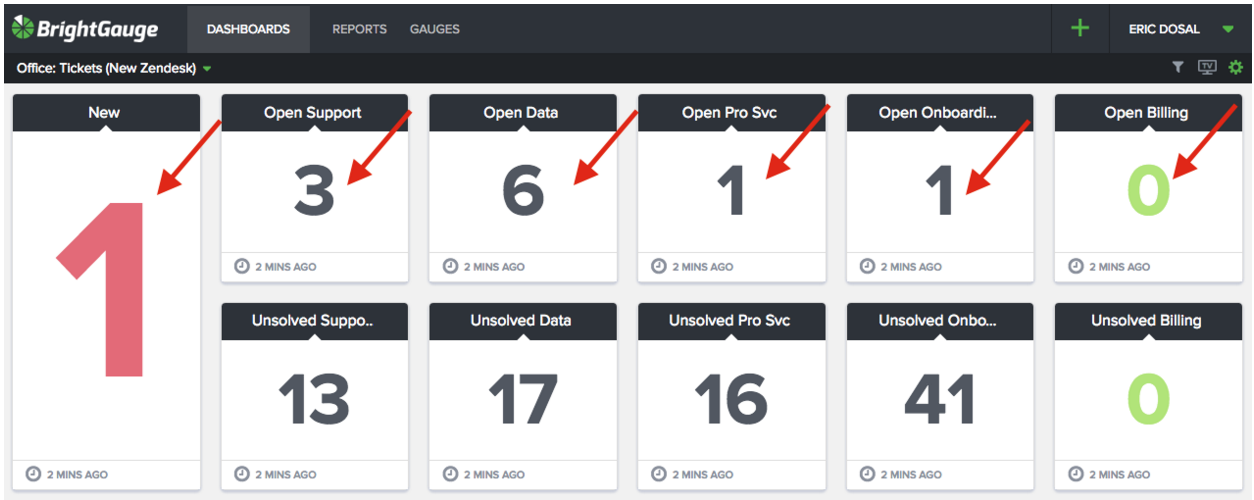
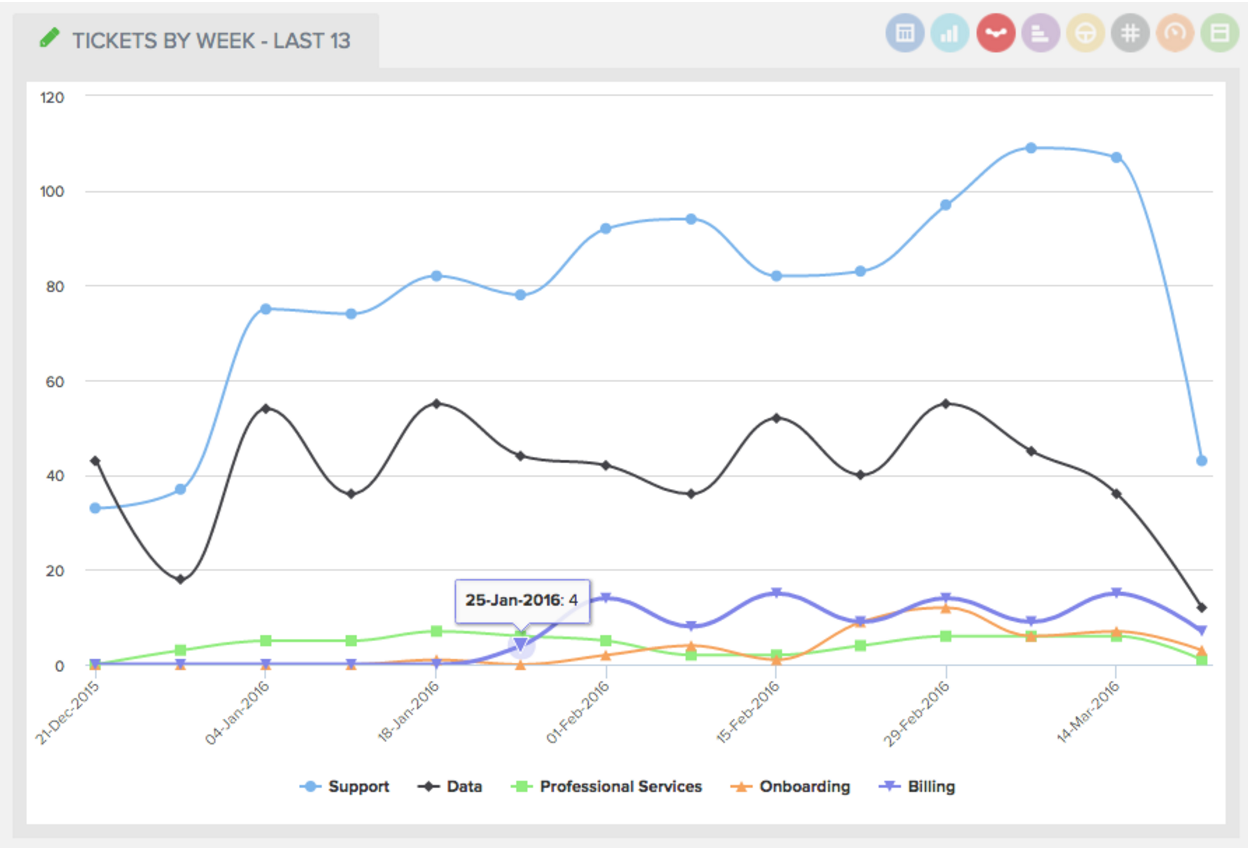
One of my favorite teams at BrightGauge is our Customer Success Team. We have 3 awesome fellas on the team (and looking to hire 1 more if you know of anyone) which is lead by our Customer Success Manager, Randall Berg. The team does a great job making sure our customers get onboarded once they sign up, receive the proper training, offer any assistance with customization they might need and of course address any support related questions that come up during the process. With the functions of the team easily divided, we then started tracking how many open requests each function had. As you can see from the screenshot below we break out the tickets received by group and then our goal is to keep the “Open” count at zero. This allows us to “Manage by Exception” or “Manage to Zero” making it very easy for everyone to see how we’re doing. This dashboard has 2 goals which are “No Red” and “Get to Zero”. No Red - Using our colors and threshold features, we have assigned certain benchmarks for our numbers that indicate a problem. In the example above, the “New Tickets” is in red because we never want to have any tickets in New status that we haven’t responded to. Additionally, we have other thresholds for Open tickets. For example, if there are 10 open support tickets the number turns red. This makes it very easy to identify problem areas that need to be addressed quickly. Get to Zero - The second goal is to ensure that all the numbers in the top row (our Open Tickets for each group) are at zero, meaning the next step is waiting on the customer and not us. Once they are at zero the color turns green (using our colors and thresholds) as you can see on the right in the Billing group. While it’s so easy to make gauges and keep track of many different metrics on the Customer Success dashboard, we have to ensure that our team can easily get a snapshot of their performance throughout each day. By implementing two simple rules, “No Red” and “Get to Zero”, it makes for an effortless solution to keep everyone on the same page and accomplishing the right task at the right time.

70+ Metrics for MSPs

Key metrics and accompanying formulas to help MSPs skyrocket growth and success!

Get your KPIs

3 Insights Every Service Manager Needs to Know

We love data and our customers love data, but data is just a part of the story when looking at a data-driven lifestyle. From the data, we need to gather insights because insights make us aware of what areas of our business we need to better manage and focus on. Here are a few insights your Service Manager can glean from the right metrics showing the right data... How busy is my team? This trending line graph allows you to visually determine whether your team is experiencing a spike in volume or whether activity is within your normal range. By having this metric handy you can quickly and easily make changes to your team and staff up as necessary. How busy are each of my team members? With a simple scan of our bar chart of “Currently Open Tickets by Member” you can quickly see at a glance how busy each team member is. More importantly, you also see how busy they are in relation to one another which gives you an opportunity to move work from one member to another. How efficient are my team members? With a bar graph similar to Currently Open Tickets by Member, this gauge shows which of your team members are closing the most tickets. If a team member is following behind others it might signal a coaching opportunity is needed or perhaps they need to be better trained. While the fast-paced world of MSPs revolve around so much data, make sure that you’re focusing first on the metrics that will make the biggest impact for your business. To learn more about how to identify the ‘right’ metrics that will ensure your success, download our free whitepaper.

Why We Developed 3 Guardrails to Help Manage our Business

I can’t speak for all areas of the world where our readers are from, but the economy right now in the US is a bit shaky. Over the past 6 months we’ve experienced a drop in the Chinese economy, we’ve felt the squeeze of exchange rates across the globe, a general decline in the stock market (including a big sell off of technology stocks in 2016), plus we are in an election year with no clear winner. Perhaps saying that 2016 is starting off a bit shaky is actually more of an understatement. As a small business owner (BrightGauge has 15 employees and growing) these macro factors can impact our business in 2016, so as we began the planning for this year we wanted to make sure we stayed more cautiously optimistic in case the economy does take a turn for the worse. We are fortunate that because we are a data company we keep an eye on our metrics across our business on a weekly (some daily) basis to make sure we are performing in line with expectations. To rely on your Profit & Loss statement at the end of the month is too late in the world we live in today. But another great process we went through this year was developing our guardrails for running the company. Guardrails are the rules or requirements we have decided as a management team to put in place and ensure we operate in a zone we are comfortable with. These guardrails were set at the beginning of the year and are not to be broken or adjusted without a major shift in company direction. Let’s talk about the 3 types of guardrails we have developed for BrightGauge... keep in mind that for the purposes of confidentiality we have changed the numbers but not the concepts: Money The most obvious guardrail that any business owner should have in place is Minimum Profit. Let’s assume that in order to run your business comfortably and save some money for a rainy day you need to operate the business with a profit of $100,000 per year. Just by having that number written down and committed to making it a guardrail means that any investment decision you have should consider the impact to your potential profit for the year. Time Although most people place a higher value on money versus time, I would argue that time is much more valuable. Brian and I have a guardrail on how many hours we are willing to put in each week to live a balanced life. If we find ourselves or anyone on our team bumping up against that guardrail on a regular basis we know we need to reevaluate the workload and/or find another solution to help get the work done. Unit Economics Guardrails can also apply at a micro level to any investment you make or any customer or contract. For example, with any marketing investment we make we have a defined ROI of 5x before we consider it successful. Therefore before we consider making an investment in a new marketing channel or sponsoring a conference we review what we expect the return will be, to ensure we can achieve a 5x return. The same can be applied for any company using Gross Margin minimums, Product Margin minimums, even Sales Quotas. All of these are guardrails that help ensure you are still within the boundaries that you set at a more micro level (deal specific, person specific, line of business specific). While these are 3 examples of some broad-category guardrails we use at BrightGauge, it’s important for you to take the time and decide which guardrails are the most important for your business. Once you have your guardrails in place, you have to monitor them on a daily, weekly, monthly basis (feel free to use BrightGauge) to make sure that you stay in line. Remember, it’s much easier to make small adjustments as you’re tracking than it is to make a more drastic change when you review your monthly P&L.

Answers to the Top 5 Questions Heard by our Data Team

One of our major investments in 2015 was the creation of the Data Customization Team. This team now has three dedicated individuals that focus 100% of their effort on ensuring that our customers have their data tailored to the way they want to see it. Here’s a list of the top 5 most popular questions they receive. Meet Kristian, Rick, and Randall: our Data Customization team Can We Get More Data? Yes and no. If you’re on premise, most likely yes. We limit our default queries so as to not put a strain on the SQL database but we often have queries in house ready to apply to accounts for people wanting more data, so just ask! Sometimes they don’t work and we need to limit data being pulled in and often removing data related to automated tickets works best (removing boards or tickets/time entries associated with these automated users). Some databases however do not allow for this extended data pull. We’re constantly looking for ways to make our queries more efficient or find new tables that allow for larger data pulls, so do not hesitate to ask. If you’re using a cloud product, then the answer is most likely no. We’re often limited by the vendors on how much data we can pull through their APIs. That being said many vendors are switching over to newer API protocols and/or changing how their APIs are structured so this could change at any point. This is a continual work in progress to constantly try to bring more and more data for our customers. Can We Add a Custom Field? Yes! Send our team a screenshot of the field you want to use and any associated data. If it’s a custom ticket field, send us the screenshots for a few tickets. If it’s a custom company field, then send that screenshot for a few companies. We will then find it in the database and see if it can be added. Most likely there are no issues and we can add it in at no cost. There are some instances where the data needs to be manipulated and if that’s the case, then we will need to have our Professional Services team take a crack at it, but you never know if that’s the case until you ask us and get the process started! Can We Get the SLA Data in Business Hours? Depending on your PSA, it most likely already is! SLAs are something you’ll configure in your PSA tool and different tickets can be assigned to different SLAs, so if ticket 1 is on a business hour SLA, then BrightGauge will show it with that data. If ticket 2 is on a 24/7 SLA, then BrightGauge will show it with that. Now not all PSAs report SLA data. For those that don’t, we manually calculate SLA data as times from opened to close and that is on a 24/7 clock and unfortunately we have no way of doing that on business clocks at the moment. We Had Our Own KPI Tool In-House Before Signing up with BrightGauge. Can We Get That Data Replicated in BrightGauge? Of course you can! There are two ways to get this tackled: Take a look at our default datasets. Many of these will contain much of the same data that you were pulling in previously, just in a different format. If the data is there, then just build a gauge to reflect the data in the way you want to show it. You can also reach out to us on the Data Team to help you build those gauges. If the data is not contained in the default datasets, then you can take the SQL queries that you were using before and put them in BrightGauge. On your datasets page, you’ll see a “Create New Dataset” button and that’s where you can paste in your SQL query. If it’s an advanced SQL query, then there may be some issues, but our support forum contains documents that can help you format it or our support desk can help you with it too. Just send an email and we’ll be glad to assist. There’s Data I have In-House That isn’t in a SQL Database. How Can I Use It in BrightGauge? Use our DropBox integration! This integration allows users to take spreadsheets, save them as CSV files (a basic form of spreadsheets that most spreadsheet tools can save as), and then upload them to BrightGauge. Info on this process can be found here. Once you’ve uploaded the file as a new dataset in BrightGauge, it will automatically update anytime you update the file! It’s just that simple. Have a question that wasn’t answered here? You can reach out to the Data Team via support.

Our Top 5 Billing Questions, Answered

This is the first in a series of “Top Lists” related to BrightGauge where we share more details about some of the recurring questions / comments we receive from our customers regarding different areas of our app. Billing is a very critical part of our overall software and it’s important that our customers have complete transparency when it comes to billing. So with that in mind, here are the Top 5 Billing Questions we wanted to address: how to access the BrightGauge billing portal How can I change the email address that receives invoices? All aspects of managing the billing of your account occur within our billing portal that is hosted by our 3rd party credit card processor. In order to update the email that receives the invoice you simply visit the Billing Portal and update the contact information. For more details please visit: Updating Your Billing Account Contact Info How can I add multiple people to receive the invoice each month? Unfortunately at this time we can only allow one email address per account to receive copies of invoices each month. We have heard some requests from customers about changing this limitation so we are looking to update this in 2016. In the meantime, most of our customers have the email sent to a distribution list that way it’s easy to change on their end. For more details please visit: Updating Your Billing Account Contact Info How can I add a new data source to my account to bring in more data? This is a simple process, you can visit our Billing Portal and under the “Configure” option you’re able to add as many data sources as you would like. We are constantly adding data sources to our list of featured integrations, like our two most recent of QuickBooks and SmileBack, so keep an eye on our Integration Page for updates. For more details please visit: Adding Data Sources To Your Subscription Do you accept other forms of payment besides credit cards? At this time credit cards are the only form of payment we accept for our month to month subscription customers. As you can probably appreciate, with such a small team working on so many different priorities, it would be very difficult to invoice customers and collect money via checks. However, if you would prefer to pre-pay your subscription we do accept check or wire transfer and will extend you a 10% discount for a 12 month prepay. For more details please: Contact Us Where can I find my old invoices? Spoiler alert, like a few of the questions above we are going to send you back to the Billing Portal for this information. All of your invoices (we call them statements) can be found by logging into your Billing Portal under Statements. For more details please visit: Reviewing Invoices / Statements We hope you found this information useful and if you ever have any questions regarding your subscription you can visit Billing Portal Help Docs or simply email us at billing at brightgauge dot com.

Our 3 Takeaways from Tigerpaw Partner Conference 2015

Last month, Larry and I attended our first Tigerpaw Partner Conference in Omaha and we walked away very impressed - not only with user participation but also the level of knowledge that was being shared. After 3 days in Omaha we had a few key takeaways that we wanted to share… Larry gets ready to start our day at the booth Tigerpaw One - We were there for the big keynote announcement of Tigerpaw One and could feel the excitement in the room. James Foxall, the CEO of Tigerpaw, did an amazing job sharing all the new benefits of Tigerpaw One. I think the biggest applause came when he announced customers would get all the modules of Tigerpaw included for free for 12 months. That really shows the confidence they have in the product. Tigerpaw Software is Data Rich - We sat in on a few sessions with topics about all the important data that Tigerpaw has inside and what they and others (like us) are doing to expose that data. During the Product Roadmap, James shared the updates they’ve made to their “Matrix Data Mining Tool” which is bringing some very powerful information out of the system and into the hands of the users. We were excited to learn about this because as one of Tigerpaw’s leading Dashboard and Reporting partners we are all about exposing that rich data to the customer and allowing them to make better decisions with their data. Sharing Best Practices - One really cool theme we picked up on was how the Tigerpaw community believes in sharing with each other. Whether it was at the happy hour, in between sessions, or over a meal, we constantly heard Tigerpaw customers talking and sharing ideas. They were willing to open up and share everything they have to offer in order to help one another. Speaking of sharing best practices, I was honored that Tigerpaw asked me to present during one of the breakouts on the topic of “Driving Higher Profits By Understanding Your Customer’s Needs”. Please check out the slide deck below: We were so impressed with the event, the attendees and the location that we are definitely coming back next year to Tigerpaw 2016! Hope to see you there.

Free Webinar: The Stages of MSP Maturity, featuring Dave Cava

As the story goes for most folks in our community, growing your MSP typically starts with a very small team (or even a solo operation), and a big-picture goal of where you want to be in the future. While the technical expertise is often second nature, learning the business side of things often takes a little more time and attention as you learn to navigate through the different stages of business growth. As part of our ongoing Educational Webinar Series, we decided to tackle the topic with special Guest Speaker, Dave Cava, to share his “Stages of MSP Maturity”. As the co-Founder and COO of a New York-based firm that specializes in managed services for alternative investment firms, Dave offers real-life advice on the stages of MSP business maturity. I heard Dave speak in Chicago last month and found the information he shared to be right on point which is why I asked Dave to come speak to our community. During the webinar, you’ll not only learn how to identify which stage your business is currently at but you’ll also walk away with a clear understanding of the steps necessary to get your business to the next stage in your journey. The session will focus on answering questions such as: What needs to happen for a MSP to grow from infancy to healthy, full-blown adulthood? How do your team and your service offering need to evolve to stay on track as you grow? How does a MSP transform from startup to a multimillion-dollar machine? and so much more! To RSVP, click the image below or visit: Stages of MSP Maturity

Our Latest Content

// Siteimprove tracking