Even though BrightGauge can be easy to use, data is a complicated matter, so we know there will be times when you need a helping hand. Our Support Team’s got your back. Support is at the very core of ...
Even though BrightGauge can be easy to use, data is a complicated matter, so we know there will be times when you need a helping hand. Our Support Team’s got your back. Support is at the very core of what we do because our founders come from an IT Support background and they know how important it is to have a solid structure in place. In fact, it’s not all that uncommon for Brian, our CEO, to spend time in Support, responding to tickets himself. We’ve got a lot of resources to help you when you’re in a bind, but we’ve rounded up our top Support FAQs to make things a bit easier. Top 14 BrightGauge Support questions Is BGS GDPR compliant? Yes. We’ve adhered to the compliance regulations set forth by the EU as of May 25th. Read more about our GDPR update here and by visiting our security page. Why am I receiving a "No Access" error after logging in? This error can occur in two cases: You have tried logging into the wrong subdomain You have logged in directly to a dashboard that you don’t have access to within your account To address both scenarios, please ensure you log in directly to your company’s subdomain: “https://yourcompany.brightgauge.co” Why is my statement missing from the billing portal? A statement may sometimes not generate within the billing portal if the payment was submitted late. In these cases, the payment will be reflected in the next statement cycle. But, if you need a copy before then, just reach out to our Support Team and we’ll send one over. How often do gauges sync? When a gauge is placed on a dashboard, that sets off the dashboard sync frequency for the dataset that the gauge is built from. This will continue as long as that dashboard is up and active in a web browser. A dataset’s dashboard sync frequency can be viewed under the Dataset settings page, or by clicking the “vertical ellipsis” icon on the top left hand corner of any gauge up on a dashboard and selecting “Gauge Info”. Gauges will also sync automatically when placed on a scheduled report. 1 HOUR prior to the report being generated, the datasets powering those gauges will be synced. If you want to do an off schedule sync, you can go to the Dataset settings page, click on the dataset, and hit “Sync”. Read our Dataset Syncing doc for more info. Why is my gauge showing incorrect data even though my datasets are syncing correctly? This is the most common question we receive via our Support Desk! The vast majority of the time, these data discrepancies are due to missing filters or incorrect filters being applied. BrightGauge pulls in raw information from your database and must be filtered down to represent the exact metrics you are looking for. For example: with PSA integrations, all boards/queues are pulled into BrightGauge by default. If you are specifically looking for a metric just from a ‘Support’ board/queue, you have to apply a filter stating that. Filters exist for date, text, number, and boolean fields. Given the large number of fields and possible filter configurations for them, we understand it may be tricky to remember how to use them, so check out this Filters Explained doc that breaks it down. Filters can be applied on all BrightGauge gauges, dashboards, reports, and goals. Why am I receiving an error for my Agent/Datasource? One of the hiccups our users encounter when connecting to BrightGauge using an on-premise datasource is setting up our agent within their unique network environment. As all of us within this industry know, no two networks are identical. Due to this, there are a few common errors that tend to arise during this configuration process. We’ve put together and are constantly updating this Common Agent/Datasource Connectivity Issues doc to help you troubleshoot these common errors. Are there different permissions that can be assigned for BrightGauge users? Certainly! Our 3 different user types are Admins, Analysts, and Viewers. Admins and Analysts are paid users with hands-on ability to create content within our app, while Viewers are essentially read-only users that are free and available with all subscriptions. Our User Accounts knowledge base article outlines the differences in more detail. When setting up a client report, must one report be created per client/customer? One of the neatest and most convenient features of our client reports is the ability to create a “one to many” report for your clients. In just a few simple steps, you can create one report and select a desired list of clients who will receive a personalized email with a copy of the report filtered down to only their company’s data. Taking advantage of this feature not only saves time when creating/configuring the reports, but also when editing or tweaking them. Changes only need to be made in one spot, but it will be reflected on what all clients see on their individual report. Check out our Client Reporting 101 doc or watch our free Client Reporting Best Practices webinar for more information. Why are my client reports blank? If all the gauges pertaining to the same datasource are blank within a specific client report, chances are the Client Mapping for that customers datasource is incorrect. Client Mappings are what we use to automatically filter client reports, but they need to be configured correctly in order to work. When configuring a mapping, the client’s name must be entered EXACTLY as it appears in the corresponding datasource database (this includes spaces and icons). Any small difference will result in the gauge being filtered incorrectly. To ensure the correct name is entered, we advise using the search function within the mapping. If you’d like to double check clients name in a database, you can check it directly within the datasource itself, or create a gauge within BrightGauge using a dataset for that datasource, and set the dimension to use the corresponding company name field. Read more about Client Mapping here. How are Feature Requests handled? Earlier this year, we removed our Feature Request Forum (for good reasons!). Here’s a detailed blog post all about it: https://blog.brightgauge.com/removing-our-feature-request-forum What has just been released? You may have noticed that we’ve recently added in-app messages highlighting our new and exciting releases. But we also cover them in much more detail in our Knowledge Base under Product Updates. We release constantly (daily) so we just summarize the customer impacting features on a weekly and monthly basis. What other datasources are being integrated into BrightGauge? ALL of them possible :) Okay, that was a broad statement but 2018 is the year of massive integrations. We have already released 7 new ones and we are only halfway through the year. All the data that matters to your business is what we’re interested in integrating. Check out our full list of integrations. Can I speak with someone live about support? Yes, of course! We just ask that we schedule it ahead of time to allow us to fully assess the issue and gather as much information as possible via the ticket. We have a slim (but awesome) support team supporting 1,000s of users so we prefer to schedule something so that we’re all fully focused and prepped. What are your typical response times for support? During normal business hours, which are 8:30am - 6pm EST on weekdays, we are usually pretty quick to respond because the team is actively monitoring the queue. But we know we have an awesome global user base working outside our support hours and when you average all ticket responses, even including nights and weekends, we’re still averaging 2.8 hours (significantly below the industry average of 20.3 hours). Have a question we haven’t covered? Make sure you’re taking advantage of all our awesome support resources or reach out to our team for more!

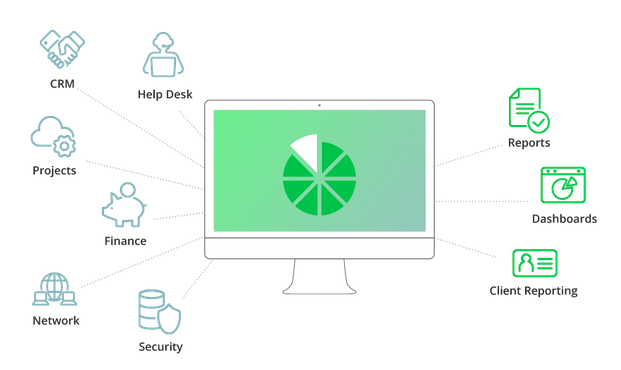
What is BrightGauge? BrightGauge is a web based application that serves as a data visualization and centralization tool for your current PSA, RMM, and Finance software(s). We help you get the most out of your data source(s) by accessing, grouping, and simplifying data that most of these tools have “hidden”/stored in their databases across multiple tables without a simple way to display or report on. Apart from accenting each software individually, BrightGauge allows you to bring together multiple data sources into our platform, whether it's an on-premise system with our secure agent or connected via an API to a hosted provider. These tools are typically built as silos with limited interoperability. Each has its unique strengths, but they keep their proprietary content “locked” internally, leaving gaps and incomplete coverage in your business. We help you break down the barriers of these data silos and bring all your key business data together. In order to help you leverage your data, there is a three step process from your datasource to the end result visualization that we will define now and explain later. The key definitions are: Datasets - The Raw Data we extract from your datasource, normalize a bit (like dates), and then make available to you to create visuals. Gauges - These are the visualizations of the data. The charts, numbers, lists, or tables that are created as representations of the raw data. Reports & Dashboards - These are the areas where you can place your gauges for regular viewing. Now that you have that basic understanding, read below for key differences and more detailed definitions of each of these terms. Datasets vs. Gauges Datasets and Gauges are what power the BrightGauge app; datasets serve as a backbone while gauges serve as a brain per se. Gauges use these fields to display information in the form of several charts such as tables, vertical bar graphs, line graphs, horizontal bar graphs, pie charts, number headings, lists, and tables. Dashboards vs. Reports Dashboards and Reports are both tools that are built off of Gauges and are used to group, display, and share data. Just like Gauges, Dashboards and Reports are customizable and can be tailored to best fit your needs.


