ConnectWise Reports Best Practices

A majority of our users turn to BrightGauge to visualize their data on ConnectWise dashboards and to help them create powerful ConnectWise reports for their clients.
BrightGauge makes it easy to set up automated, interactive reports in just a few minutes, so it’s a no-brainer to start sending them to clients on a regular basis.
Even though it’s really easy to implement, we do suggest following a few guidelines to get the most out of your reports each and every time.
BrightGauge and ConnectWise
BrightGauge works by connecting to popular datasources, pulling in their metrics, and converting the data to easy-to-access dashboards, reports, and goals. Instead of having to log in and out of multiple accounts to view the metrics you care about, BrightGauge puts all your data together in one place.
This way, you can quickly get a snapshot of your business at any given time. Whether you are using a PSA, RMM, financial tool, or other tool to manage your business, all these metrics are easily viewed side-by-side within BrightGauge. In other words, it’s never been easier to get a handle on your data.
BrightGauge integrates with both ConnectWise Manage and ConnectWise Automate and pulls in data like ticket statistics, employee billable hours, and machine status. Dashboards and gauges sync in real-time, so you’re always able to view up-to-date data, which is incredibly useful when making important business decisions.
Because our whole mission is to make your lives easier, we took the time to pre-build default gauges, dashboards, and reports based on common KPIs that business leaders like you are tracking. As soon as you open a BrightGauge account, you’ll have access to hundreds of gauges, so you can start viewing your data on day one.
It’s really easy to integrate with ConnectWise. Once you’re in your BrightGauge account, visit the datasources panel to find ConnectWise and simply enter your credentials. Our support page includes a step-by-step guide for getting started.
Things to consider when creating ConnectWise reports
Your clients likely only have a few minutes to spend on reviewing the reports you send over to them, so you want to make sure that you’re always creating the most impact in the shortest amount of time.

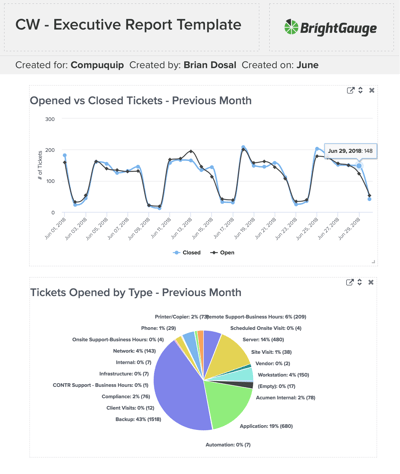
In general, the reports created in BrightGauge are visually appealing, interactive (meaning you can click into the data to drill down further and get more information), and can be sent in PDF or html format.
Beyond that, here are a few tips to follow:
- Take advantage of our default templates. When you open a BrightGauge account, you’ll automatically see pre-built reports included. Simplify your process by starting out with these templates. No matter what, you can customize it to your liking.

- Know exactly who you want to send reports to. We recommend sharing your report with more than just your main point of contact. It’s also a good idea to send custom ConnectWise reports to your contact’s boss and the CEO or other executives. That way, if your main point of contact ever leaves the company, there will still be others who have seen the value of your hard work and know that documentation exists to support your business.
- Don’t include every single metric ever. Just like BrightGauge dashboards save you time by providing a snapshot of your highly prioritized metrics, ConnectWise reports should do the same. Like we said, clients probably only have a few minutes to review your reports, so make sure that the metrics that will drive their business decisions are displayed first. This is not the time to include every last detail. It’s a time to show your value by proving that you are aware of the insights that will help your client be successful.
- Personalize your report. BrightGauge allows you to add a cover page and text and image modules to your report. Take advantage of this by personalizing each ConnectWise report for each specific client. Include their logo, a brief summary of the report findings, and context around metrics that may be more complicated to analyze. You can also make your page orientation either portrait or landscape.

- Filter your data. We bet you apply filters to your gauges and dashboards all the time. It helps you see the exact data you’re looking for. You can do the same in reports, too. Doing so can make your ConnectWise reports a lot easier for your clients to interpret. Read about turning on report filters or even excluding them if you need to.
- Determine how often you want to send reports. This may be based on what you and your clients decided in your SLA, but sending reports on a frequent basis can solidify the trust that your relationship should be based on. ConnectWise reports are transparent - they show the client both the good and the bad and they make you a really reliable business partner. Consider sending ConnectWise reports on a daily basis.
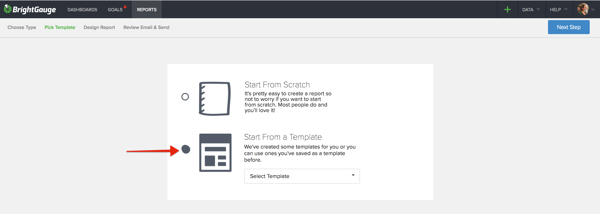
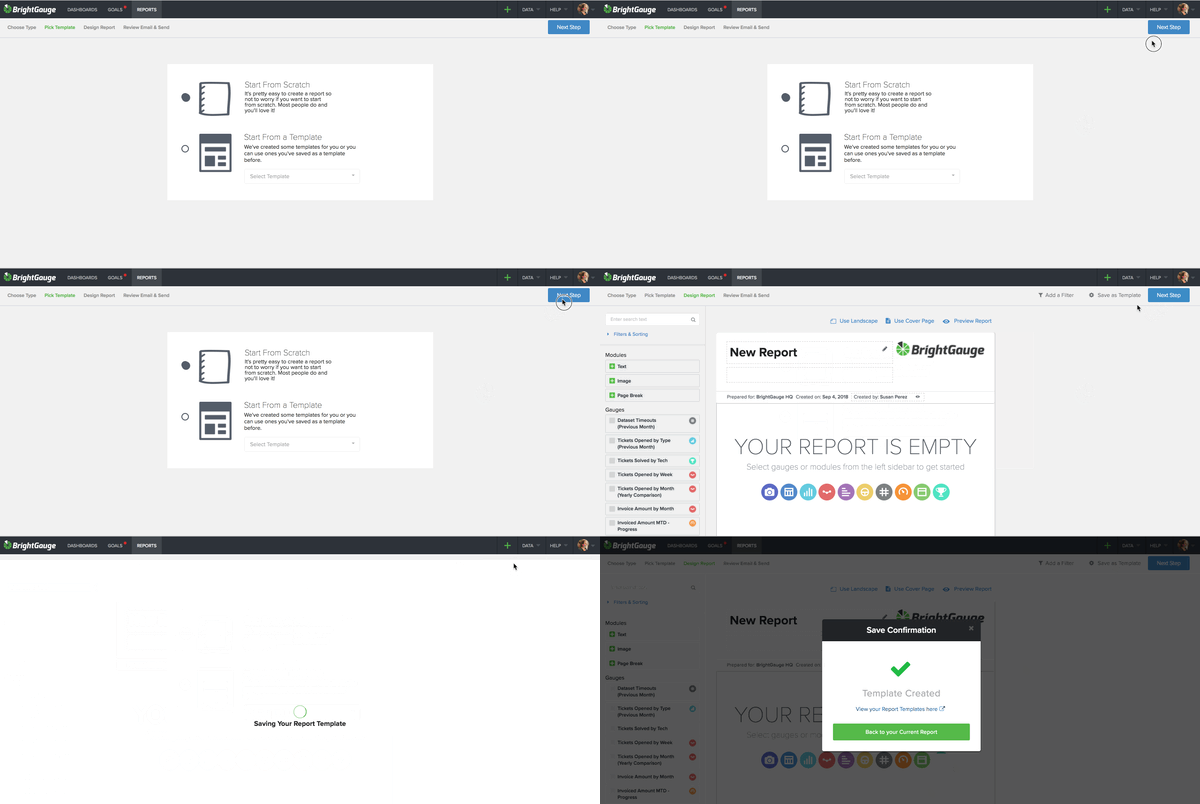
- Save your reports as templates. This one is going to save you so much time on a weekly basis. If you create a report from scratch, or even if you customize a pre-built report, you can save it as a template for future use. That way, you don’t need to recreate the report every time you want to send it.

- Automate it. Finally, when your ConnectWise report is created and you’ve saved it as a template, schedule it to go out on an automatic, recurring basis. You can tell BrightGauge exactly who to send your report to on a specific date and at a specific time. Set it and forget it, but rest easy knowing that you’re making a positive impact on your client’s daily life.
Custom ConnectWise reports through BrightGauge are nice to look at and are an amazing business practice. To learn more about using ConnectWise in BrightGauge, head to our Knowledge Base to access articles and resources specific to what you’re looking for.
Want an even closer look at how to make the most out of your client reports? Watch our free webinar, Client Reporting Best Practices.
Free MSA Template
Whether you’re planning your first managed services agreement, or you’re ready to overhaul your existing version, we've got you covered!


