Featured Integration: Dropbox

When researching the tools that we’d like to add to BrightGauge’s growing roster of available integrations, we take a number of factors into consideration, including how many of you have put in a request for this integration and how simply we can connect to the tool.
Many times, it’s such a popular tool that it’s a no-brainer for us to move forward with it. One example? Dropbox.
This is one of our most unique integrations, as the data we pull from it wholly depends on you.
How to use BrightGauge + Dropbox
First of all, connecting to Dropbox is as easy to do as any of our datasources. If you’ve already got a BrightGauge account, visit your homepage, find Dropbox, and enter your credentials. For more guidance, see these step-by-step instructions.
We have noticed that this is an often underutilized integration, but one that can be quite simple and impactful to use.
The basic premise of this integration is that if you have a .CSV file imported to Dropbox, you can visualize the data on BrightGauge dashboards and reports. That’s it!
What do I get out of the box?
We weren’t kidding when we said Dropbox is a unique one. Since this integration relies on custom data, there aren’t any pre-built dashboards, gauges, or reports included. Don’t let that scare you into thinking it will be complicated to use.
We assume that the daunting aspect of this is that, with so much freedom, it can be hard to determine what exactly you should be doing with BrightGauge and Dropbox.
All it takes is a little imagination or a little inspiration from your peers.
Examples of BrightGauge + Dropbox Gauges
We can’t stress enough the amount of versatility you get with this integration.
Perhaps you have information gathered from a tool that we don’t yet integrate with, but that you’d like to see on your BrightGauge dashboard. As long as you’ve got a .CSV with that data, you can display it on our app. Here’s how you can create a dataset from a CSV, along with some CSV requirements.
With their Dropbox integration, we’ve seen users track employee PTO, stay on top of important budgets, project quarterly sales numbers, monitor customer satisfaction reactions, view scope of work, and keep an eye on opportunities, to name a few.
The gauges look just as you’d expect - like any other gauge from any other datasource. And your Dropbox data is not limited to one type of gauge. Depending on your CSV, you can view data as a number, a graph, a table, a pie chart - all the typical options.
PTO Tracking by Employee
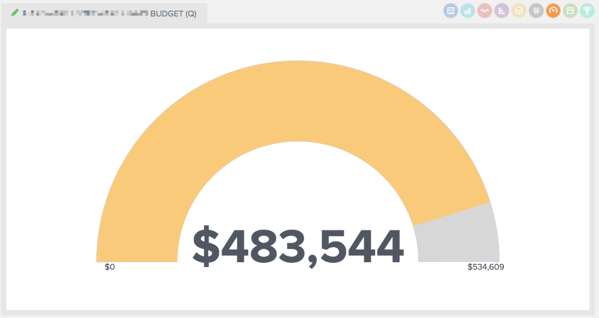
Monitoring per-project, quarterly, or annual budget

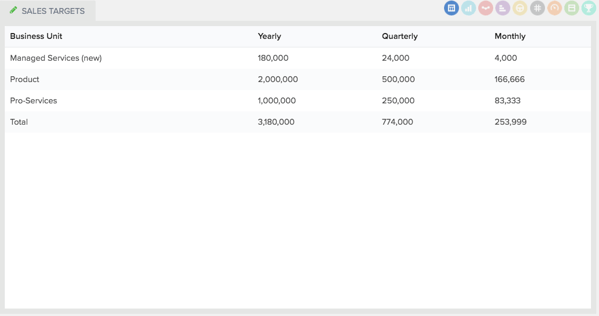
Projecting sales numbers per business unit

Get creative with your data
Your gauges and dashboards don’t have to be all work and no play. Go beyond the operational and get creative with the data you’re putting on display.
At BrightGauge, we’ve been known to use Dropbox to see who is winning our March Madness or World Cup competitions, to see our Fitbit data, or - most importantly - to keep inventory of our in-office wine supply!
We’d love to know how you’re using your BrightGauge + Dropbox!
Free MSA Template
Whether you’re planning your first managed services agreement, or you’re ready to overhaul your existing version, we've got you covered!


