
Announcing the latest datasource on the BrightGauge block: Backup Radar! Backup Radar is now live and ready for you to connect with.
Anybody in the IT industry knows that backups are an important and critical part of your daily tasks. Backup Radar is a software that automates the checking, auditing, and reporting of your backups, with the goal of saving technician time and improving processes.
When you integrate BrightGauge and Backup Radar, you’ll have a real-time view of which backups have completed and which have failed, so you can address issues before anything falls through the cracks.
How to connect to Backup Radar
Connecting to Backup Radar through BrightGauge is really simple. Visit your BrightGauge homepage, find Backup Radar within your datasources panel, and enter your credentials. You can always refer to our Connecting to Backup Radar support doc for more detailed instructions.
If you’re new to BrightGauge, you can request a demo right now.
What do I get out of the box?
If you’re using BrightGauge, it’s safe to assume that you have important data you’d like to get your eyes on ASAP. We realize that, so whether you’re opening a new account or connecting to an additional datasource, we want you to get started right away.
So what we’ve done is talked to many business leaders like you to determine the most important KPIs based on the data you’re monitoring. With that information, we’ve pre-built gauges, dashboards, and reports for each of our available datasources.
With Backup Radar, you’ll get 15 gauges, two dashboards, and three reports as soon as you’re connected. If you need a more complicated build-out, our Support Team can help you out with that.
Gauges
15 default gauges help you make sense of your data and keep track of your backups efficiently. Monitor backup success and failures, device statistics, devices in warning status, number of failing backups in the last 24 hours, success rate over a week, total number of backup jobs, and more.

Dashboards
Two default dashboards give you a holistic picture of what’s going on with your backups.
Backups Overview displays devices in Success, Warning, and Failed status, which allows you to visualize which devices backed up successfully and which need attention. The gauge drilldowns provide more detailed information.

The Result Status dashboard lets you see how many days it's been since a backup has run successfully, which jobs are working, as well as a status overview.

Reports
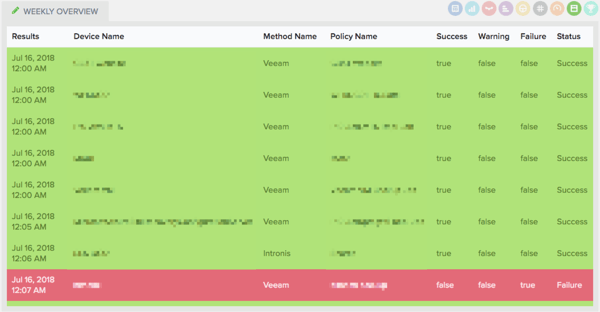
Three default reports help you remain transparent with your internal teams or with your clients who trust you to keep their systems running properly: Daily Overview, Weekly Overview, and Monthly Overview.
Keep in mind that you can always generate reports based on default gauges or gauges that you’ve created.
Goals
BrightGauge Goals allows you to set goals and keep track of each team member’s performance throughout the year. This is a really powerful way to drive accountability and motivate your employees to always be productive and efficient.
It’s always a good idea to align individual goals with overall company KPIs, so that everyone is walking the same path towards success. With Backup Radar, you can set goals like “Less than 2 failed backups per 24-hour period”, or “Days since last good result should never surpass 3”, or “10 successful backups per week”.
These are just ideas, but you can see how they would help keep you on track and motivate you to be working at error-free, optimal levels. Give it a shot!
If you’re ready to include the Backup Radar datasource in your plan, please reach out to our Success team. We’d love to hear your thoughts!

Free MSA Template
Whether you’re planning your first managed services agreement, or you’re ready to overhaul your existing version, we've got you covered!

