New Integration: LogicMonitor

In 2018, we’re looking to quadruple the amount of integrations and datasources we release. Just over a month into the year and we’re already making great progress towards this goal.
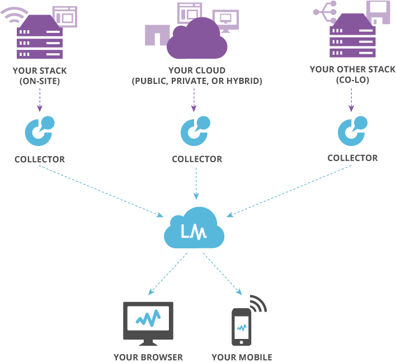
Today we’re excited to announce the launch of one of our newest integrations: LogicMonitor! An all-in-one performance network monitoring tool, LogicMonitor leverages your alerts and datacenter infrastructure to keep your devices in check.
How LogicMonitor works
Getting their start in 2007, LogicMonitor has since grown to serve thousands of SaaS companies with their hosted monitoring services. They cover storage, servers, networks, applications, virtualization, and cloud. From a single platform, users are equipped with a comprehensive, built-in monitoring and alerts center.

How LogicMonitor pairs up with BrightGauge
With LogicMonitor data in your BrightGauge, you can track all of your device alerts, statistics, and SDTs from one place. Work with one or all three of the BrightGauge built LogicMonitor datasets to scale your real-time device intelligence.

Working with BrightGauge’s Dashboards and Reports, you get to choose which data is most important to you. Use one of our out-of-the-box dashboards or cut through all of your data to the metrics that are most timely for your business. BrightGauge offers ready-to-go gauges so you can begin viewing your device and website statuses instantly. Some of the prebuilt gauges cover:
Upcoming server downtime events
Devices Not Updated in 14 Days
Server Downtime Next 24 Hours
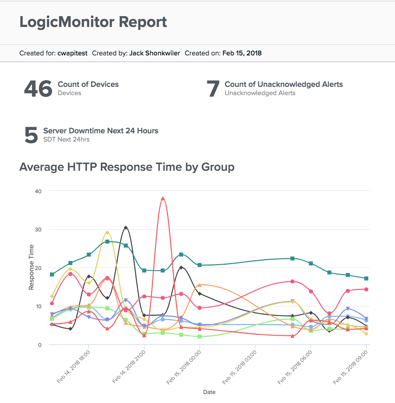
Average HTTP Response Time by Group
CPU Busy Percentage by Group
For a full list of prebuilt device statistics and alerts gauges, view the Gauges section in your BrightGauge account and sort by Datasource.
The Reports drilldown
While the majority of the integrations we partner with already come with their own reports and dashboards, they often don’t take into account the other tools you're using to manage your business. With BrightGauge, you can pair all of your datasources and customers data into one seamlessly branded, easy to use report.

Use our prebuilt LogicMonitor report or package together the information you want to share with one or many clients, save, and set it to automatically get sent out to specific clients at the duration of your choice.
How to set it up
The setup is simple. Visit your BrightGauge and select to add an additional datasource. From there, it’s just a matter of inputting your credentials and your Logic Monitor API Key. To learn more about how to get set up, read the support documentation here.
Run out of datasources or need some help in getting started? Reach out to our data experts.
Free MSA Template
Whether you’re planning your first managed services agreement, or you’re ready to overhaul your existing version, we've got you covered!


