Blog Logo-2.svg

The BrightGauge Blog

How Data Mashups Offer More Insights About Your Metrics

What do glasses, air conditioning, and data mashups have in common? They’re all valuable tools that people forget about when they're used. You may be using data mashups already, but if not you’ll ...
What do glasses, air conditioning, and data mashups have in common? They’re all valuable tools that people forget about when they're used. You may be using data mashups already, but if not you’ll soon realize how necessary they are… What are Data Mashups and Why are they Valuable? There are two types of data mashups: datasource mashups and dataset mashups. Both are only available in our Advanced plan. Dataset mashups are a combination of two or more datasets into a single gauge. With dataset mashups you could create a Member Scorecard. Datasource mashups are like dataset mashups but are pulled from two or more sources. Metrics such as Tickets Per Endpoint (where you need to pull data from both your PSA and RMM) make this feature a must. Gauges using data mashups provide much more context than traditional gauges because they offer significant insight, even in instances where metrics wouldn’t be useful if apart. Data Mashups in the Wild Ok, that’s a fancy title for mashup examples, but here are some gauges that you need to know because you should be using them regularly: Technician Utilization This Week uses dataset mashups. It pulls data from ticket statistics and member data. Technician Utilization Today also uses dataset mashups. It pulls data from ticket statistics and member data. Advanced Hours Actual Today By Member uses dataset mashups. It pulls data from ticket statistics and member data. Two more datasource mashup metrics which we can provide via our data customization team are Hours Per Endpoint and Margin on Agreements (revenue from QuickBooks - sum of hourly cost from the PSA). Ready to see data mashups in action? It’s as simple as requesting a free one-on-one demo. Note: if you’re an existing customer, send an email over to Support and we’ll be happy to show you data mashups!
request-a-brightgauge-demo

[Podcast] Episode 25 with Colin Knox of Passportal

Before launching Passportal, Colin Knox spent nearly 2 decades in the MSP business, most recently as the Owner of Xcel Professional Services. In less than 7 years, Colin founded the IT Services business, grew it to $4M in annual revenue, and then lead the efforts in selling the booming company. In our conversation, Colin walks us through each chapter of the story, from growth milestones of an MSP to the idea, process, and transaction of selling the business, plus the valuable lessons he learned along the way. Starting, Growing, and Selling an MSP: Episode Highlights Colin’s introduction and background (0:56) How business changed with each growth milestone at Xcel Professional Services (4:25) Balancing project work with monthly recurring business (8:24) A closer look at Xcel’s size, structure, and more (10:52) Making the mental shift between working in the business vs. working on the business (13:05) The thought process behind selling Xcel Professional Services (16:24) A timeline of activities leading up to the sell (19:00) Addressing the business valuation before starting due diligence (23:49) Lessons learned during the process and transaction of selling Xcel (29:14) How many people do you tell during the process, and when? (34:18) An introduction to Passportal for MSPs (39:10) Rapid-fire Q&A: best book recommendation, favorite resources for personal development, parting advice about acquisitions, how to reach Colin (42:30) As mentioned in the episode: The Lean Startup: How Today’s Entrepreneurs Use Continuous Innovation to Create Radically Successful Businesses, by Eric Ries Driven: How to Succeed in Business and In Life, by Robert Herjavec Want to find out more about The BrightGauge Podcast? Check out all the episodes here.

Subscribe to get the latest content delivered to your inbox

New Feature Alert: Introducing the LabTech Health Report

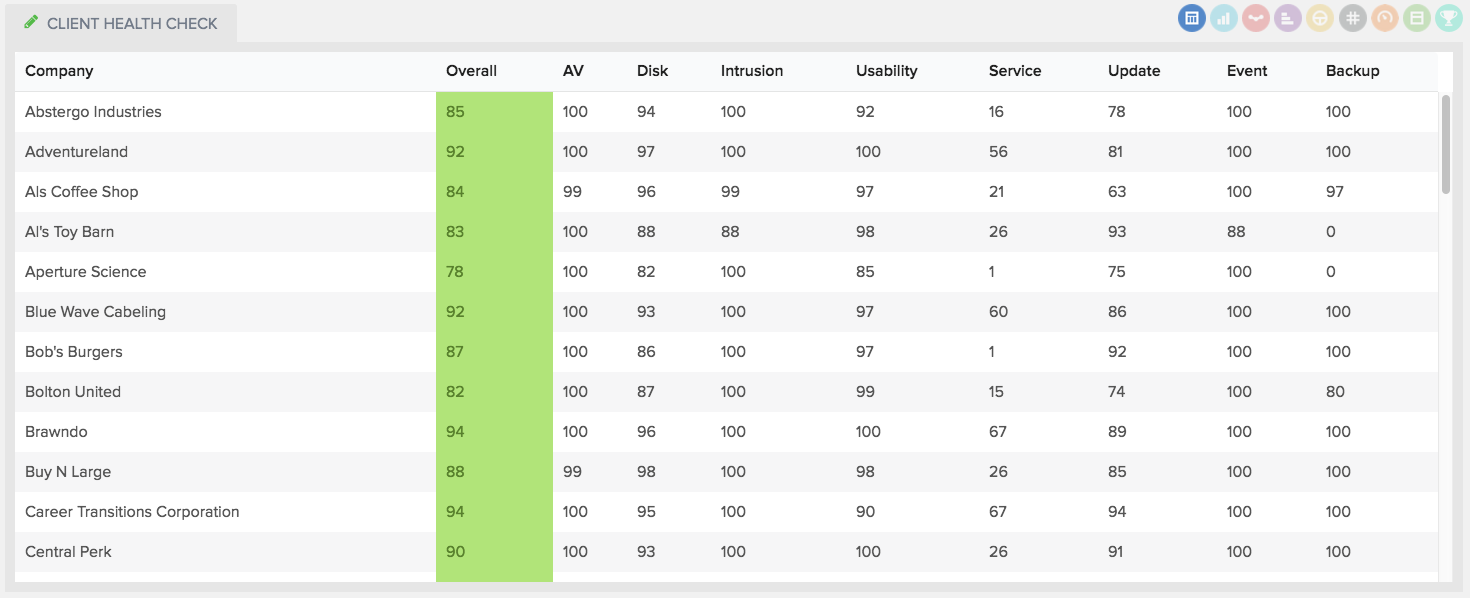
If you keep up with our Product Updates, you may have noticed that we’re putting out lots of small updates and feature releases lately. Some of these delightful features, as we call them, may contain nothing more than a single gauge, but they are always a great benefit to our customers. This time, we released the LabTech Health Report Gauge (also referred to as the Client Health Check). If you’ve been a long-time LabTech user, you have probably come to rely on this report, and now with BrightGauge it’s even better: Sample Labtech Health Report Gauge The benefits of taking such a granular look at customer health include: The ability to identify trends and issues. For example, you may notice that your AV scores are low across the board. If that's the case, your team may not be updating definitions often enough. A clear look at which clients are in need of attention, before they reach out to you about it! Enhanced ability to serve as vCIO. You’ll have the data necessary to advise your client when upgrades are necessary. See how BrightGauge makes it easy to unleash your LabTech, PSA, and Financial data with easy-to-use dashboards & reports How are the Health Scores Calculated? We don’t do any calculations on our end, instead, we use the calculations that LabTech has created, but we go a bit further by searching in multiple locations for that data. This extra step helps to ensure the accuracy of your data. Here is how LabTech calculates each metric: General: 100 is the highest possible score for each category. 1 is the lowest possible score for each category (even if no points are scored, the score will show as 1). 0 means that the data is not available. Antivirus (AV Health): Checks if an antivirus is on the machine. Worth 50 points Checks if the virus definition files are up to date. Up to date: Less than 8 days old Worth 25 points Checks if an antivirus’ auto protect function is enabled. Worth 25 points Disk (Drive Health): Checks for the number of drives. Each drive is weighted equally so if you had 3 drives and two fully pass their checks you’d have a total score of 67. [(100 + 100 + 1) / 3] Checks if each drive has an acceptable amount of drive space remaining. Worth 15 points Checks if each drive has an acceptable level of fragmentation. Worth 15 points Checks if each drive passed all SMART tests. Worth 40 points Checks each drive for recorded event errors. Worth 30 points Intrusion Health: Checks if the number of failed login attempts for this computer are below the acceptable limit. Acceptable limit set to 25 login attempts. If the number of failed attempts exceeds that limit, a score of 1 (fail) is given, otherwise a score of 100 is given. Usability (Performance Health): Checks the average CPU usage over the last 8 days. Maximum average resource usage allowed is 40%. Worth 30 points. Checks the number of CPU spikes over the last 24 hours. 10% above average CPU usage is considered a spike. Maximum number of spikes allowed within a 24 hour period is 6. Worth 10 points. Checks the average Memory usage over the last 8 days. Maximum average resource usage allowed is 40%. Worth 30 Points. Checks the number of Memory spikes over the last 24 hours. 10% above average Memory usage is considered a spike. Maximum number of spikes allowed within a 24 hours period is 6. Worth 10 points Checks if current OS version meets minimum version requirements. Worth 20 points Service Health: Checks if all critical services are running during agent check-ins. Critical services are Windows services that are not drivers or printers. Each day a score of 1 (fail) or 100 (success) will be given. Even if only one service is stopped, a score of 1 will be given. The score shown is an average over time. Update Health: Checks for Standard Patches that are not installed Standard Patches are patches which are not categorized by Microsoft as a “Critical” or “Security” patch and don’t have any severity assigned. Worth 5 points Detects for Elevated Patches that are not installed. Elevated Patches are categorized by Microsoft as a “Security” update or have been assigned a severity rating below “Critical”. Worth 20 points Checks for Critical Patches that are not installed. Critical patches are categorized by Microsoft as a “Critical” update or have been assigned a “Critical” severity rating. Worth 75 points Event Health: Checks for critical errors in event logs. Backup Health: Checks if there was a successful backup. Each day receives a score of 1 (fail) or 100 (success). The score shown is an average over time. When coupled with all your other data already in BrightGauge, we’re sure that you’ll find tremendous value with the new LabTech Health Report gauge! Learn More About BrightGauge Don’t use BrightGauge yet? BrightGauge helps you to unleash your LabTech, PSA and financial data with easy to use dashboards and reports. Learn more about LabTech + BrightGauge by scheduling a free demo:

Why You Need Free, Unlimited Dashboards & Reports

I must have missed a memo or something. Since when did people start thinking it’s okay to pay for business intelligence that limits the number of dashboards and reports they can create? That’s like paying for Microsoft Office and then finding out that you can only create 5 documents or spreadsheets a month with it. It’s your data and you should be able to consume it however you want! At least, that’s what we think at BrightGauge, which is why we don’t limit the number of dashboards and reports that you can create. Here’s why you need to have unlimited dashboards and reports: The Benefits of Unlimited Dashboards and Reports There are two primary benefits to having unlimited dashboards and reports: Scalability and the ability to share reports with each and every client. But, to say those are the only benefits is a bit premature. Let’s look at these benefits one by one: Scalability As your organization grows, you’ll need to have more dashboards and reports as new departments are formed, managers and execs are brought on, and staff as a whole increased. If you were limited in the number of dashboards you could create, you'd be unknowingly creating a data dictatorship! If you had unlimited dashboards instead, you’d be able to keep your data democratized as your business grows. We’ve talked about data democratization before, but we can’t stress how important it is! Data democratization allows you to increase transparency, enable your managers and employees to make better decisions and motivate good behaviors in your company as employees see how their work impacts the business. Sharing Reports with Clients The ability to share reports with each of your clients may not seem like a big deal at first, but what if I told you it could increase your bottom line? I bet you’re interested now! Sharing reports with clients will build trust, which, in turn, increases satisfaction and then lowers churn. In addition to increasing client satisfaction and decreasing churn, client reporting paves the way for higher paying clients as it shows them that you are meeting and exceeding SLAs on a consistent basis (which you should be doing if you’re a data driven MSP). Free Your Data Our competitors insist on putting limits to how often you can access your data and make you pay to share it with viewers, but we put you first, and because of that, we won’t charge you extra for creating or sharing new reports and dashboards. If you’re ready to experience the benefits of unlimited dashboards and reports, let us show you how to liberate your data with BrightGauge!

Choosing the Most Powerful KPIs for Your Organization

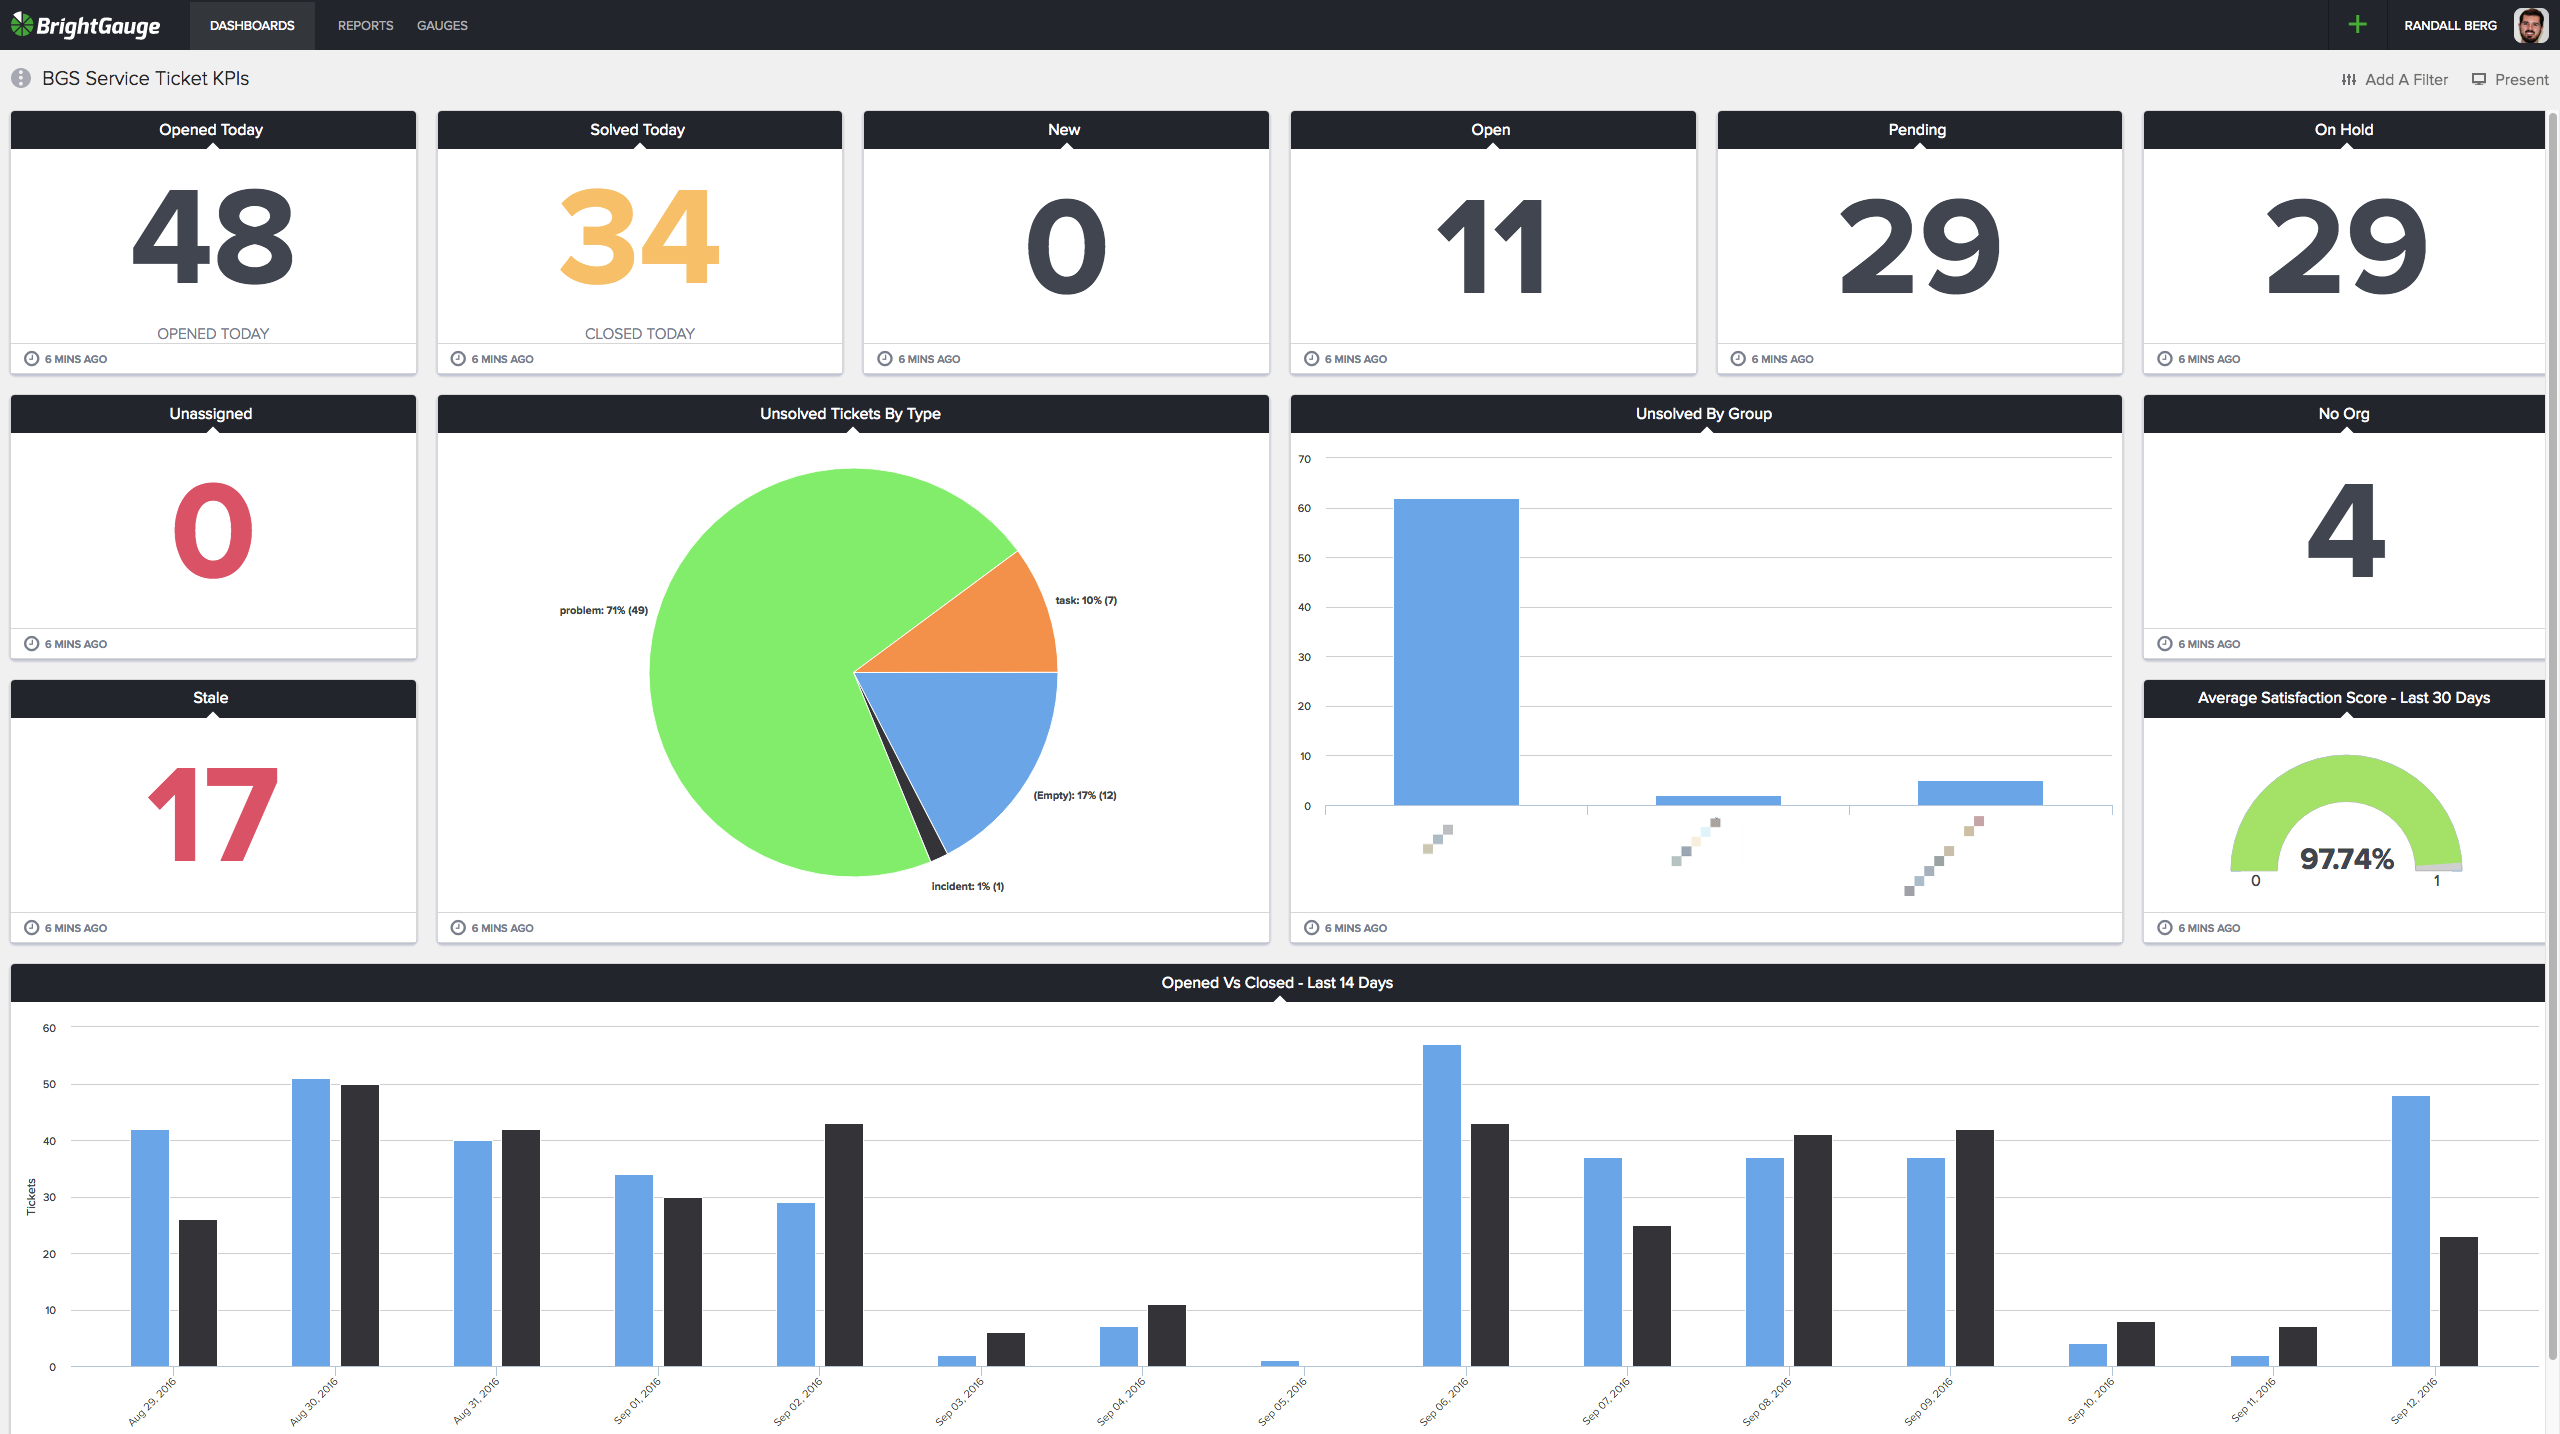
If you are looking to improve the performance of your organization as well as the individuals within it then you will benefit by using key performance indicators (KPIs). Key performance indicators allow you to: Increase productivity. You don’t want people doing busy work or focused on the wrong things. Establishing KPIs allows you to determine whether your team is working toward the right goals and what adjustments need to occur to keep productivity high. Improve performance. KPI metrics provide a measuring tool for determining if employees are performing at the level expected for their role within the organization, while assisting the company in reaching its strategic objectives. Make better decisions. Choosing the appropriate actions to take depends on the goals you want to reach. KPIs help reduce uncertainty by providing a basis for determining which decisions will lead you in the right direction. To achieve these benefits you must choose the right KPIs, which is something that doesn’t come easily. Here is the BrightGauge Guide to choosing KPIs: An Overview of KPIs Many wonder what the differences between a KPI and a regular metric are. It can be difficult to tell the difference, especially when you realize how closely the two are related. Every KPI is a metric, and every metric has the opportunity to be a KPI (for the right company). So what’s the key to identifying your organization's KPIs? First, for it to be a key indicator, it must be critical and relevant to the organization’s success. As this Industry Week article suggests, KPIs should measure performance toward the strategic objectives that you’ve laid out as part of your organization’s performance plan. It is absolutely critical that these KPIs measure the most important factors in achieving your success. Stay away from the minutia. Next, KPIs must be quantifiable, controllable, and repeatable. If team members cannot influence the outcome, you’ll find it difficult to gain their buy-in. Selected KPIs might include improved customer service response rate, increased revenue from the sales team, or a decrease in past due receivables. A key indicator means the outcome or expectations are measurable. KPIs are a gauge. They should have a specific expected outcome that you can track over time. Finally, when it comes to choosing the right KPIs for your organization, consider your main purpose is to determine how to drive business performance. How Many KPIs Should You Have? Well, the short answer is 3, but things are rarely that simple. You’ve got several different departments and people at different management levels who will all be focused on different goals. The real number of KPIs will depend on the size of your business. So instead of just three KPIs, follow the rule of threes. The best way to explain is with a realistic example of a larger organization’s KPIs: Top Level Management: Sales Growth (Net Promoter Score) NPS Employee Engagement Mid Level Management: Sales: Sales Growth Opportunities Sales by Rep Marketing: Sales Growth Marketing Qualified Leads Site Visits Service: NPS Customer Satisfaction (CSAT) Average Time to Acknowledgment HR: Employee Churn Employee Tenure Employee Engagement As you can see, upper level management has 3 KPIs and mid level management has 3 KPIs per department. This doesn’t mean that each department needs 3 unique KPIs, they often will share KPIs like Sales Growth and NPS in the example above. How Often Should You Measure KPIs? There is no universal rule when it comes to how often you check your KPIs. Each metric is different and every company is different, so where one company may check theirs daily, weekly could be sufficient for another. We recommend you don’t go longer than a week without checking KPIs, but feel free to experiment and see what works for your company! We keep ours on a dashboard in the BrightGauge HQ so that anyone on the team can tell with a glance how we are performing: The Service Ticket KPIs dashboard at BrightGauge HQ How Do You Ensure KPIs Will Increase Performance? KPIs will increase performance so long as they meet the following conditions: Are leading, not lagging indicators of performance Reflect areas of the business that impact performance the most Measure metrics that when improved guarantee future success Examples of KPIs that will increase performance are: Churn Rate Sales Growth KPIs that wouldn’t increase performance are: Net Profit Customer Service Awards Won Should KPIs be Directly Controllable and Manageable? Yes… and no. The KPIs you choose should be able to be impacted by the actions of managers and staff, but you don’t want them to have direct control over the metric. A great example of how controllable a KPI should be is Net New Customers. Net New Customers can be impacted by the actions of sales and marketing staff, but short of buying the product themselves, there is no way to directly control the KPI. This forces your staff and management to generate and close more leads, increasing performance. How Should Your KPIs be Visually Displayed? Even if you choose the best KPIs, a lack of visualization tools can hinder your ability to increase your business’s performance. In order to ensure you’ll be increasing performance on all levels you should be displaying your KPIs on dashboards around the office and in reports distributed amongst your team. Our customer, Nucleus Networks, uses dashboards throughout their office to display KPIs Recap on Choosing Your KPIs: KPIs are a useful tool for creating a high-performing culture. They allow you to balance quantitative and qualitative measures to understand desired performance, but in order to achieve these benefits you have to remember to: Follow the rule of threes when determining how many metrics to choose. Measure your KPIs as often as necessary, but no later than weekly. Choose KPIs that increase performance. Choose KPIs that can be impacted by your team, but can’t be directly controlled. Display your KPIs on a dashboard around the office and in reports sent to your team. Need KPI inspiration? Check out 70+ metrics for MSPs, plus their accompanying formulas:

70+ Metrics for MSPs

Key metrics and accompanying formulas to help MSPs skyrocket growth and success!

Get your KPIs

Jessica Hunter Joins BrightGauge as Customer Success Specialist

The BrightGauge Team is excited to announce the arrival of Jessica Hunter as Customer Success Specialist! Looking Back... Jessica was born and raised in the Miami area, a trend that seems to be fairly common among the BrightGauge team. Although local, she did get to spend a significant amount of time traveling during summer breaks, going to places such as Nicaragua, Arizona, Colorado, and Delaware to name a few. She attended South Miami Senior High and Western Governor’s University for college. After graduating with her Bachelor’s degree, she worked as a Network Engineer for Metrowave Broadband (a Miami Internet Service Provider) where she managed and monitored their networks, worked with the NOC team on priority ticket escalations, and assisted on projects that involved cloud services and third-party API integrations. Becoming a BrightGauger Jessica is excited about being part of a team that makes the customer their priority. As she explains, she places a high value on customer service because she has received bad service all too often. In Jessica’s eyes, one of the best things about BrightGauge is our customer service, so she can’t wait to contribute to the team and help keep customer satisfaction high! We always ask our new teammates about the reasons why they decide to join our team, and as Jessica explains, she was sold on our “innovative and progressive software, and the high value of teamwork” in our office. She also loves the culture that our co-Founders, Brian and Eric, have created, specifically noting that everyone is family oriented, everything we do is a team effort, and everyone here helps each other out when they can. On top of that, Jessica appreciates that we also place a strong emphasis on building friendships with each other outside of the office, with many of us making plans together after work or on the weekends because we know that those strong ties will make us a more cohesive team. After Hours When she’s not working, Jessica likes to relax and unwind by playing games, cracking open a book, or practicing yoga. She is always looking for ways to express her creativity whether it’s through art, music, photography, or another medium. She also loves to try and understand the complexities of the universe through physics. Jessica and her furry friend practice yoga in their free time Join us in giving Jessica a warm welcome to team BrightGauge!

Announcing Our Valuable New QuickBooks Online Integration

QuickBooks Online (sometimes abbreviated as QBO) is a cloud-based accounting software for SMBs. QBO offers the ability to track income and expenses, create estimates and invoices, manage and pay bills, and more. We’re thrilled to be able to make it easier than ever for you to access and analyze your QBO data! Launching this new integration all started with one comment on our blog: Then, another: Before long, you were asking us often about a QuickBooks Online integration. We heard you loud and clear. Now, we are excited to present our brand new QuickBooks Online integration! Our QBO integration gives you the ability to visualize and track your financial metrics in real time. You no longer need to wait for your P&L (Profit and Loss) at the end of the month. When combined with any of our other integrations, you’re provided with a single view of the metrics you need to run your business. You no longer need to log into each data source and spend hours creating and updating a spreadsheet. Sample QuickBooks Online Dashboard and Gauges One of our favorite QuickBooks Online metrics breaks down your YTD revenue by type. This enables you to see trends in the type of revenue you’re making. Another great QBO metric to track is your Service Margin Percentage. This helps you understand trending performance and will help you increase your profit margins. Sales Cost as a Percentage of Revenue/Gross Margin is perfect for performing Sales expense analysis. This metric gives you the ability to understand how sales will fit into your cost structure. You can also track your revenue using whichever time frame you choose! Our sample QuickBooks Online dashboard breaks down revenue by quarter and year, but with BrightGauge, you have the ability to watch it monthly or even daily!

How Jones IT Uses BrightGauge to Prove Value to Their Customers

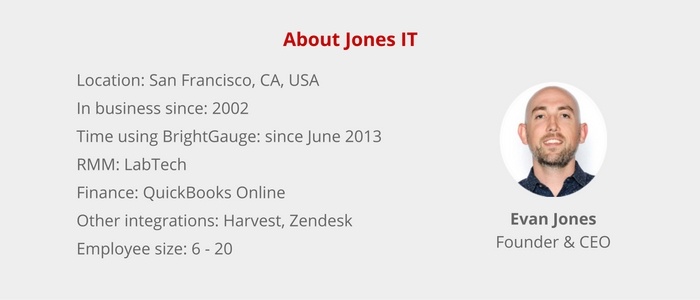
[Case Study] As Founder and CEO of Jones IT, the task of proving value to customers was posing a serious challenge for Evan Jones. The company was growing quickly and doing a lot of work, but it wasn’t always easy to relay to customers the work that was being done when it came to tickets completed, servers being patched, or plenty of other tasks. Evan explains that in the beginning, “The main thing we wanted was to prove our value to customers. They’re paying us a lot of money, and we’re doing all this work, but we weren’t necessarily showing them the work that we were doing and proving it to them.” Finding the Right Tool for the Job Proving ROI to customers was made even more difficult by the “ugly” reporting tools built-in to the RMM solution the Jones IT team was using. In fact, the tools were so frustrating for the team to use, that most of the time they didn’t even bother trying to create client reports. The Jones IT team also realized that whatever solution they found for the reporting job would need to be something simple enough so that even their customers would understand the information being presented. An Eye-Pleasing, Simple Solution For a brief time, Evan’s team tinkered with building their own reporting solution, but when he found BrightGauge at a conference, the platform’s features and overall look quickly convinced him to ditch the enormous customization task. Getting started with BrightGauge was a fairly easy process for Jones IT. While there was a small learning curve, Evan utilized the BrightGauge team as needed for any Q&A resources, and he goes on to say “I think we know everyone on a first-name basis [at BrightGauge]; all the teams have helped, they’ve done specific projects for us… we’ve had some custom reports made, and gauges… I think we’ve put you guys to the test.” “A Really Positive Experience” Since implementing BrightGauge, one of the big wins that Evan noticed for his team was being able to trim and in some cases, eliminate alerts. Before, they would get alerts on instances such as servers down or network down - and in fact, there were so many alerts that they were being ignored and were considered useless information. Now, there are no more alerts to look at because they’ve been replaced with gauges on tv’s. “It’s easy to jump in and get it done without worrying about all the false alarms”, explains Evan. Another triumph, resulting from the use of BrightGauge dashboards, was the ability to better track and manage the company’s outsourced work. Evan tells us “We utilize some outsourced services from other countries to manage a lot of our LabTech stuff and working with outsourced companies you need to be very explicit in what they need to do, how they need to do it, what their role is, and what their job is. We’ve found that BrightGauge is a good way to keep track of them to make sure that they are doing what they need to be doing.” The results showed with the internal team as well. During a recent dashboarding session with each of his four teams, Evan taught them the fundamentals when it comes to using BrightGauge. Whereas before, the only dashboards the team had were the ones Evan had created, he wanted to give every individual the power to create their own. Evan goes on to say “I gave them the power to create their own reports and some of the guys really dove in and started making dashboards for their teams to monitor their clients and they got excited about it and actually started using it and trying to gain efficiency. That was a really positive experience.” Recommending BrightGauge Harvest is by far the most useful BrightGauge integration for Jones IT, because it provides huge insights into their efficiency. The team can now see trends at a glance that would have been significantly more difficult to spot before. Evan concludes by saying, “any Harvest user should use BrightGauge. It’s a no-brainer. The access to the data that BrightGauge provides is leaps and bounds above what they provide organically.”

[Podcast] Episode 24 with Mike Maseda of CoAdvantage

When it comes to keeping up with the ever-changing world of people management, small business owners can easily get lost in the tides of benefit offers, talent acquisition, and ever changing legal codes. How do you know if you’re taking the right steps and making the right calls? How do you know when it’s time to call in an expert, and who do you speak to? We know how confusing Human Resources can be, and that’s why we invited Mike Maseda, President & CEO of CoAdvantage to join us for a conversation on what you need to know as a business owner. From the changes to U.S. wage laws taking effect in December 2016 to solving the challenges of talent acquisition and retention, and a closer look at healthcare reform, Mike covers it all. Human Resources & People Management for SMBs: Episode Highlights Mike’s introduction and a closer look at CoAdvantage’s PEO services (0:55) How do SMBs know when it’s time to find a solution like CoAdvantage? (5:42) Advice on how to improve the talent acquisition challenges that most SMBs face (7:49) Once you attract talent, what are the keys to retaining those employees? (9:22) The challenges of being compliant as an SMB in today’s workplace (12:10) Changes coming to the U.S. Wages & Hours laws in December 2016 (14:15) Advice to employers who will be affected by the new wage laws (16:25) Penalties for employers who don’t comply with the new wage laws (19:26) Upcoming changes to know about healthcare reform (20:40) Where should employers go to learn about new legislation? (23:48) General HR and payroll advice for small business owners (25:14) What benefits are most small companies offering to employees? (28:29) How are national and global economy fluctuations affecting the growth of CoAdvantage’s customers? (31:38) Rapid-fire Q&A: best business book, areas that Mike focuses on at CoAdvantage, parting advice, how to reach Mike (33:39) As referenced in the episode: Scaling Up Excellence by Robert Sutton & Huggy Rao Want to find out more about The BrightGauge Podcast? Check out all the episodes here.

How to Manage Service Team Productivity [Free Webinar Download]

Our Customer Spotlight webinar series features BrightGauge power users sharing the tips and insights that have helped them grow and manage their business each day. In this session, we take a look at how to better manage productivity of one of the most important resources for an MSP: the Service Team. In “Managing Productivity of a Service Team”, we’re joined by Karl Fulljames, VP of Operations at Nucleus Networks for a closer look at the specific reports, metrics, and management approaches that he uses when it comes to leading his Service Team operations. Karl shares Service Team management and leadership best practices, with topics including: Managing Service Team productivity Using data to improve Operations How to use a Dispatcher ticket close process Holding the team accountable with transparency Top metrics your team uses and much more! If you missed the live webinar, you can still access the full recording and slide deck here:

Why MSPs Continually Choose BrightGauge over Integration Solutions

Many of our integration partners have had their own dashboard and reporting solutions (we call them integration solutions) for a couple of years now, and while we’ve discussed how they’ve impacted us before, we’ve not really talked about how their solutions differ from our software. Let’s start by discussing the integration solutions: Integration Solutions First off, these are usually free - which is a major benefit. You can try them at no additional cost to you, and receive some benefits from the data. But, as the saying goes: “you get what you pay for”. Users of integration solutions tend to face the following challenges: Limited customization Poor naming schemes Clunky Slow refresh rate And more That’s not to say that integration solutions are bad, they are usually pretty decent, but since they are offered at no additional cost, there is often little incentive for time and resources to be dedicated to improving them. That’s where BrightGauge comes in: BrightGauge Dashboards and Reports Before we begin to dive into the specifics, it’s important to note that BrightGauge doesn’t compete with the integration solutions and instead compliments them. Our integration partners have so many priorities that they don’t have the time to build a better dashboard and reporting solution. We fill in that gap by putting 100% of our time and resources into developing data solutions that save you time, save you money, and help grow your business. Everything Under One Roof One of the most apparent benefits to using BrightGauge is the ability to see all of your important data in one place. Integration solutions will only provide the data from their platform, but BrightGauge has 14 integration partners and is constantly adding to that list. You can easily monitor your financial, service, and operations data in one place. Data Source Mashup and Calculated Metrics Dataset Mashups are a combination of two or more datasets into a single gauge. This gauge can then be displayed on one of our dashboards or reports and provides extra value over traditional gauges because of the ability to gain insight from your data more efficiently. Example metrics that use data source mashup are tech utilization, member scorecards, and advanced hours actual by member. Calculated Metrics, another one of BrightGauge’s most powerful features, allows you to get more from your data by taking two metrics and using basic math to see data you wouldn’t be able to easily identify otherwise. This includes metrics like ticket kill rate. % of 1 touch resolved tickets today, and more. Calculated Metrics makes it easier than ever to manage your data Dashboard Templates BrightGauge offers dashboard templates for each of our integration partners. This allows you to get valuable insight from your data as quickly as possible! In fact, we often hear that getting started with BrightGauge is quicker than the time it takes to get insight from your data in integration solutions. Click here to see our many dashboard templates. 150+ Prebuilt Gauges What good is a customizable dashboard if you can’t easily customize the dashboard? This is where many of the integration solutions are weakest. With BrightGauge you’ve got 150+ prebuilt gauges so that you can easily create custom dashboards and reports in a matter of minutes. Customer Service and Data Customization Team on Standby When you need something extra, such as help on a specific project, BrightGauge provides free customer service along with a data customization team. From troubleshooting data discrepancies to creating a custom gauge, you can count on us to be there. Which Solution is Right for You? It may seem like a difficult choice, but choosing the right dashboard and reporting solution is easy when you follow these 2 simple steps: Since integration solutions are free, we recommend that you give them a try. Get a good feel for how they can benefit you, what is possible and where they may fail to meet your needs. Go ahead and request a free BrightGauge one on one demo - the demo usually only takes 20 minutes of your time and will help you see whether BrightGauge is right for you. After trying both the integration solution and having your one on one BrightGauge demo, you’ll be able to decide which solution will help save you time, save money, and grow your business.

Our Latest Content

// Siteimprove tracking