Blog Logo-2.svg

The BrightGauge Blog

Our Take on Tech and Networking Events in Miami

The Miami tech scene is in its dynamic youth. If we look back not too many years ago, it’s safe to say that tech-related events were few and far between, but now there are events almost every week. ...
The Miami tech scene is in its dynamic youth. If we look back not too many years ago, it’s safe to say that tech-related events were few and far between, but now there are events almost every week. As a software company, keeping up with these tech gatherings (and other networking events) in Miami is important to our team because we’re excited to see this special community grow. Plus, we also enjoy the opportunity to learn and teach alongside others who have the same passion that we do... not to mention, we know the challenges and growing pains that come with creating a startup! Since the tech community in the greater Miami area is still relatively small, we really pride ourselves on keeping up with what’s going on with different companies, mostly by attending events as often as possible. We’ve even created an “Events” channel in Slack to help keep a running list of all the upcoming meetups, happy hours, breakfast groups, networking, and more! Similar to our series on The People Behind the Product, we asked our teammates to fill us in on some of their favorite local events, and here’s what they had to say: Randall: I like to attend the Refresh Miami talks because they're often more seasoned and appropriate for the type of business we do and need info on. I appreciate the talks more so than the meetups as it's a chance for me to learn. Steve and David at Refresh-ing Hour with Brian Breslin, Founder of Refresh Miami. Brian: In previous years, before a little baby and a fast growing company, I attended more events locally. I'm planning on attending more Refresh Miami events in the second half of 2016. Plus any other appealing tech events but from my research, Refresh seems to hold the most applicable events. I usually come out of events with the following takeaways: Keep going (in the company) Keep working hard Keep fighting to grow Find good talent A lot of folks who attend Miami’s tech events are trying to start companies and being surrounded by like minded individuals gave me more confidence that we can really build a special company and succeed. I always recommend Refresh events to anyone interested in tech in Miami. It's the go-to group just to connect with other like minded folks trying to stay in Miami and be in this industry. With a caveat of this industry being size of companies as well, Refresh is geared to non-large tech software companies. Amanda: I enjoy trying a mix of professional events: Like some of the others here, I've done Refresh Miami events - last summer there was a cool look at Conversion Marketing (aka Growth Hacking) presented by Dropbox. That was nice because the Miami tech community usually features events that are a bit more focused on developers or founders, so I enjoyed the marketing theme for a change. There was a full house for Refresh’s Dropbox feature! For social opportunities in the Tech community, the weekly Waffle Wednesday sessions hosted by LiveNinja are a popular choice... not to mention the gourmet waffles are delicious. LiveNinja’s waffle bar Not specifically related to tech, but from a networking perspective, I really enjoy teaching others about Inbound Marketing and the results we see from the methodology, so I was excited for the opportunity to co-host a Content Marketing workshop last year. There's something really cool about being able to help inspire others in their marketing, answer questions, and trade ideas in a room full of like-minded people. I also recently joined the Young Professionals organization here in Coral Gables for its mix of professional events and community outreach. I enjoy it because I get to meet a variety of people from different professions, and also have great opportunities to make a difference in the neighborhood, like the time we painted a mural for the local middle school. Orlando: The last event I went to was one of the Jurnid Sessions. It was an interesting Q&A style event about the state of Miami as a tech hub. The panel mostly talked about how raising money in Miami is difficult because investors from outside Miami can be hesitant to invest down here. It was an interesting panel and most of the people on it were interested in improving Miami's tech scene. It was a good event and there was networking after the panel stopped taking questions. I am definitely interested in attending other Jurnid Session events. Steve makes a connection during the Jurnid Session event Adam: I went to "Jurnid Sessions// The State of Miami's Tech Hub | Real vs. Hype" (the same event as Orlando) recently and that was interesting. My main takeaway was that there is some hype within the Miami community, but not about Miami from the outside. That and to focus on doing the work first. Eric: Most of the events I've attended recently are related to YPO (Young President's Organization) and they focus on education and leadership development. However in 2017 I'm excited to attend BrightGauge’s Gauger Rager, but we'll have to wait until later this year to share what that's all about. My biggest takeaways are that getting out of the office and of your normal routine to learn from others is a great use of time. Any time I attend an event I usually walk away with at least one nugget of information or make one interesting contact. Last year I went to eMerge Americas and that was a lot of fun if you're in technology in Miami or South America. They bring a lot of different topics together and the collaboration is amazing. What the Future Holds… Our team has only skimmed the surface when it comes to tech events in Miami, and we’ve started to attend more events just as the frequency of events is picking up. You can expect to hear more about local events on our Twitter, Instagram and blog. If you’re looking for some events to attend yourself, check out the Refresh Miami Event Calendar.
request-a-brightgauge-demo

[Podcast] Episode 21 with Ryan Markel of Take Ctrl

There’s a good chance you’ve heard by now about a handful of different peer groups for the MSP/ITSP industry, and for good reason - they bring results to business leaders. We’ve even featured some conversations on them here before, specifically taking a look at what to expect if you’re considering joining one. This time we asked Ryan Markel, President of Take Ctrl, to join us for a conversation on how he’s grown the IT business he co-Founded, as a direct result of joining the Robin Robins peer group. Ryan shared with us about learning to lean on his new network of like-minded industry leaders, to the business lessons he’s learned, how to face and resolve hiring challenges as a leader, and even how to provide more value to customers by focusing on service. Leveraging Peer Group Resources to Achieve Growth: Episode Highlights Ryan’s intro and background (0:54) A day in the life as President of Take Ctrl: how duties are divided between partners (2:27) The decision to move from break/fix into a MRR model (4:49) Lessons Learned in the Robin Robins peer group (The Producer’s Club) (6:43) What size MSP business joins a peer group? (13:31) Facing the hiring challenge as a MSP leader (14:41) A closer look at Topgrading and how it works (17:12) How Take Ctrl is driving growth each year (21:37) Deciding on the price per user (24:37) Getting to know customers before marketing to them (27:10) New operational abilities that didn’t exist before adopting BrightGauge (30:37) Rapid-fire Q&A: best business book, blogs to follow, parting advice, and how to reach Ryan (36:32) As mentioned in the episode: Books: Scaling Up, by Verne Harnish and The Big Five For Life Continued, by John Strelecky Blogs: Krebs on Security, Seth Godin, Technology Marketing Toolkit An example of Asset Management using BrightGauge, as referenced by Ryan: Want to find out more about The BrightGauge Podcast? Check out all the episodes here.

Subscribe to get the latest content delivered to your inbox

Why Free Viewer Accounts Matter in BI Tools

Imagine that you just bought a movie, but were charged for each person who watched the movie with you. That’s similar to what many BI tools do when they charge businesses to add user accounts. We believe that you shouldn’t have to pay to let your team or clients view your data, which is why BrightGauge gives viewer licenses to all customers for free. The Benefits of Free Viewing Accounts Free viewing accounts have three primary benefits: They allow all of your clients to access relevant data which builds trust, increases client happiness, and lowers your churn rate. They allow all members of your team to consume the data contained on your dashboards increasing team performance, efficiency and, ultimately, your bottom line. They allow businesses that value transparency to share their performance numbers, showing clients that they are in fact meeting their SLA and promoting an honest work environment for your team. Viewers, Admins and Analysts Let’s take a look at the differences between BrightGauge’s user types: Viewer We designed viewer accounts to be used for team members that don’t need access to the gauge builder, or for your clients. A Viewer is a user who has read-only access to the dashboards that are shared with them. Viewers can be added for free to any BrightGauge subscription. Admin An admin has full access to the BrightGauge platform, giving them the ability to create datasets, gauges, dashboards and reports. The number of Admin users available is based on your plan with additional users only $25. Analyst An analyst account is similar to an admin in that it has the ability to build gauges and reports, but they differ in that they cannot import their own data sources or create their own datasets. Analyst accounts are only available with the Advanced plan. To learn more about the different plans and adding admin or analyst users to your account, check out our pricing page. What Other BI Tools Charge: While other BI tools charge as much as $125.00 to add more viewers, BrightGauge allows you to create them for free. Viewers can receive reports and log into dashboards so they can consume all the data. Learn more about how to add and manage/delete viewer accounts.

Year One of The BrightGauge Podcast: our Top 5 Episodes

If you had told us at the beginning of last summer that we were about to embark on a new version of content at BrightGauge, we probably would have thought you’re crazy. There’s definitely no way we would have believed that mid-summer 2016 would see us 20 episodes in to our own podcast, and with a waiting list for new guests! It all started as a casual chat about new forms of marketing content between myself and BrightGauge co-Founder, Eric Dosal. While it’s hard to remember all of the details in that conversation, it’s safe to say that the excitement snowballed and before we knew it a microphone was ordered and we were sitting down to record our first episode, all within a matter of weeks. Cut to a year later, and it’s hard to believe that it’s all flown by so quickly! We’ve had a ton of fun welcoming our guests and sharing each episode with the community - not to mention that we’ve learned a ton also! Since we’re celebrating a landmark for The BrightGauge Podcast, let’s take a look back at our Top 5 most-listened to episodes (or find all the episodes on iTunes or SoundCloud): Episode 10: Driving Better Team Behavior with Dashboards, featuring Nick Olerud of NetrixIT Everyone realizes the correlation between dashboards and data management, but how do dashboards help with team management? We invited Nick Olerud, Director of Technology at Netrix IT, to join us for a conversation about how Netrix leveraged dashboards and the resulting transparency to increase SLA compliance, help hold each teammate accountable, and manage their Sales funnel. Then Nick’s discussion with Eric Dosal works it’s way into all the details of positioning and balancing co-managed IT deals, plus an inside look at the Traction EOS system for operating a small business. Episode 9: All About Customer Satisfaction (CSAT) for Service Providers, with Brad Benner of SmileBack Ever wonder how an idea for software comes to life? And what’s the big deal about customer surveys, anyway? In our conversation with Brad Benner, founder of SmileBack (branded as Nex.to at the time the podcast was recorded), we first learned a bit about how he picked the solutions that Nex.to focuses on and the process of bringing those ideas to life in the SaaS market. Then Brad offered us a comprehensive look at all aspects of Customer Satisfaction for Service Providers: the need for using a specialized CSAT tool, how Nex.to helps boost survey responses, the best ways to utilize CSAT data, and so much more. Episode 5: Growing a MSP Business, featuring Josh Kotler of Western Digitech When building a Technology Services company, how do you keep up with ever-changing industry trends in order to grow your team and business? As the head of a rapidly growing MSP practice, Josh Kotler knows all about the challenges and opportunities we hear from many other folks within the community. One of the topics Josh covers is the role of vCIO and how Western Digitech utilizes them along with Network Admins to ensure the right solutions are in place for each client. Besides diving into the vCIO role, Josh also chats about contract structures, dividing his team into key delivery areas, setting customer expectations, and more. Episode 3: Building a Sales Team, featuring Matt Gallo of United Data Technologies If growing a Sales Team from scratch and then maintaining their precise focus isn’t hard enough, how will you approach the topic of their salary? Matt Gallo is the Territory Sales Manager of the SMB Division of United Data Technologies based in Miami. He joined us to talk about his experience in building a sales division for one of the largest Managed IT teams in South Florida: his transition from sales to sales management, keeping his team focused on hunting new business, the candidates he looks for in the hiring process and even the hot topic of how to compensate a sales team. Episode 6: Insights from MSP Coach and Expert, Gary Pica What better way is there to learn about the MSP industry than from someone who has already forged the path? Gary Pica is well-known for being founder of the TruMethods peer group, but prior to that Gary owned one of the fastest-growing MSPs in the States with over 7,000 endpoints under management in a multimillion-dollar practice. As the head of TruMethods, Gary has coached more than 1,500 MSPs over the course of the last 5 years - and we were thrilled that he shared some great industry insights with us. With year one under our belts on The BrightGauge Podcast, we’re thrilled to see where the next chapter takes us! If you have a topic suggestion for an upcoming episode, or if you are interested in joining us as a guest, please leave a comment below.

Why You Need a Vision, Goals, and Metrics (in that Order)

Your priorities are wrong and so are most other businesses’. No, I’m not referring to your work/life balance. I’m talking about how you and other businesses have let metrics become the captain of the ship while your vision is forgotten. Businesses tend to fall into the trap of thinking that metrics should set your goals which in turn create your vision, when it’s actually the other way around! This doesn’t mean being data driven is wrong, it’s a necessity, but most companies go about being data driven in the wrong way. Here’s how to do it the right way: Vision: The Key to Success Even though the term “data driven” would suggest that your data drives your business, you’ll actually want to be driven by your vision. Your vision is why you started your business in the first place. It’s what determines where you’re heading and will determine what you achieve! Your vision is more important than your metrics because metrics can only tell you where you’ve been and how you’re doing. They don’t tell you where you will be going like your vision does. Taking Action First, ensure you have a vision. If you don’t have one, now’s the time to make one. Hint: why did you start your business? Many companies display their metrics with dashboards on TV’s, but few put their vision on the wall like they do their metrics! Be one of the few companies that proudly displays their vision so that your employees know to work towards that vision. Some examples of famous corporate-brand visions: “To offer designer eyewear at a revolutionary price, while leading the way for socially-conscious business.” (Warby Parker) “To create a better everyday life for the many people.” (IKEA) “To bring humanity back to the skies” (JetBlue) Once you’ve got your vision, you can begin to create goals. Goals: Milestones Towards Achieving Your Vision Goals are the smaller chunks that make up your vision broken down into achievable milestones. Ideally, these are in the form of quarterly SMART (Specific, Measurable, Achievable, Realistic, and Time-bound) goals. Each goal that you successfully complete brings you closer to achieving your vision. Taking Action Take the time to create a few SMART goals based on your vision. Unlike a vision which isn’t always measurable, these need to be clearly and quantifiably completed. Here’s a great example of a goal: Based on Warby Parker’s vision (“To offer designer eyewear at a revolutionary price, while leading the way for socially-conscious business.”) we can create the following goal: Lower the price of our glasses to $85 from $95 by the end of Q4. You can have one goal or create multiple goals, just ensure that you don’t lose focus with too many goals! Once you have your goal (or goals) you can move on to discovering your KPIs. Metrics: Making Sure You’re Reaching Your Goals Metrics, and more specifically KPIs, are what you use to ensure you’re on track and will reach your goals and eventually your vision. Contrary to popular belief, your KPIs don’t actually tell you how much progress you’ve made towards a goal. They only indicate your performance. Here are a few other things that metrics can and can’t do: Metrics can: Measure performance Inform decisions Expose opportunities and challenges Metrics cannot: Fix your problems Motivate your staff Run your company Taking Action Your KPIs will be determined by the goals you set, and they should be able to provide the full picture as to how your business is performing. You want to avoid choosing more than 5 KPI’s as it would become too difficult to actually track performance, but choose too few and you won’t have the picture. 3 or 4 KPIs is the sweet spot. Example KPIs: Continuing with the Warby Parker example, if your goal is to lower the cost of glasses here are the metrics you may want to track: Total cost of goods Profit Number of glasses sold Number of glasses returned for quality issues These metrics would allow you to see your cost of goods which tell you how much you could lower the price, profit to ensure your margins are still good, glasses sold to see how the new pricing is affecting sales, and the number of glasses returned for quality reasons - important if you switched to a cheaper material and it’s not holding up as well as previous materials. Conclusion Remember, vision is more important than goals which are more important than your metrics. Get your priorities in order and become data driven by starting with your vision. If you don’t, your business will lose what drives it in the first place.

70+ Metrics for MSPs

Key metrics and accompanying formulas to help MSPs skyrocket growth and success!

Get your KPIs

4 Ways Transparency and Dashboards Go Hand in Hand

Businesses and the leaders within them are using the phrase “need to know” less and instead are beginning to embrace an “everyone should know” mentality. In other words, businesses are adopting the idea of transparency at a rapid pace. There are many reasons as to why transparency has become such a big deal, but one of the largest reasons is the ability to change behavior both in your staff and your customers. If you’re not fully sold on the importance of transparency in business here are a few vital statistics: Transparency increases customer satisfaction by close to 20% (according to an HBR study) It also increases employee efficiency by 13% or more (according to the same HBR study) Transparency is the top factor in determining employee happiness (according to a Tinypulse study) These benefits have led many businesses to look for ways to increase transparency. We often hear from our customers that one of the main benefits to using dashboards is the increase in transparency that they easily provide. Dashboards are one of the best ways to display metrics for tracking performance, and there’s no hiding from those numbers. If something isn’t going well, it shows, and that transparency will help your team to work together to address the issue. The data speaks for itself and creates transparency without a large amount of effort from management. Here are the top 4 reasons our customers love to use dashboards to increase transparency: 1. Your team will be on the same page An important benefit of increased transparency in a company is the ability to ensure your team is working together and with a shared vision. Studies show that when teams are on the same page they feel more confident, put more effort into their work and deliver more predictable work. In order to achieve those benefits, you’ll need to help get them there. You could take the time to meet every day and ensure that everyone is on the same page, but that requires a large portion of time from you and your team. A better way to do this is to put dashboards up around the office on computer or TV monitors. This will result in a quick and easy way to ensure your entire team knows what’s going on and can keep an eye on important metrics. In this scenario, you’ll want to place some of your KPIs on a dashboard in a place where your team can be instantly informed as they walk by. 2. You will align everyone with certain metrics to improve Part of being transparent is keeping your team in the loop and sharing with them key metrics even when the numbers aren’t pretty. One of the benefits of being so open about your business’s metrics is that your team will know when there is a particular area of the business that needs extra attention and will be able to use the data to determine which methods are working and which aren’t. It's proven that tracking key metrics and sharing them will increase the performance of your team when done on a long-term and regular basis. Whether you share in the form of a weekly report or you keep a monitor/TV on at all times for the team to see, you’ll receive great benefits from constantly tracking the metrics that matter most to your operations. 3. You’ll celebrate victories together When you display your data on a dashboard for all to see, you allow your team to know when they have improved a metric. Seeing an objective finally achieved creates a great boost in company morale and brings your team closer together. Think about the last time you worked towards a combined sales goal or customer satisfaction goal and you hit it. Surely you felt a great deal of accomplishment when you knew that you had achieved success in that area! Making your metric transparent and available to everyone not only allows them to experience the same feeling of accomplishment, but it also results in everyone working hard to achieve the goal. 4. You create a little friendly competition In some cases, such as a customer service or sales environment, you can create a little healthy competition by putting everyone’s performance numbers up. This transparency allows team members to see how they compare to their peers and often results in an increase in performance. Our new leaderboard gauge was designed just for this and is a great example of how a dashboard can be used to create competition. You do need to be careful not to create too much competition, but with a little creativity, you can display individual performance numbers while creating team based competition. When creating competition, keep in mind that you want your team to be working together to hit a metric, not working against each other. How we use dashboards at BrightGauge HQ Since we are a dashboard company, it only makes sense that we use dashboards all over our office, and the benefits like an increase in our team’s efficiency, are invaluable. We track all of our customer support work on dashboards and display those on TV monitors around the office so that we can easily see how many tickets are open and also what phase they are in. This allows us to immediately see where we stand and helps to keep the team all on one page. It also helps to shed light on which areas we need to dedicate more resources and time to by aligning the team with metrics to improve. Because the dashboards are up for all to see, we can celebrate when we’ve hit an important metric and it also creates a little bit of competition when our team sees who’s leading in a certain metric. Conclusion Remember, transparency is a powerful tool to change employee behavior, customer interactions and ultimately your company’s bottom line. The easiest and most effective way to increase your transparency around the workplace is to use dashboards to display key metrics. Dashboards are helpful because they: Get everyone on the same page Align your team with key metrics to improve Boost morale when victories are achieved Create a little healthy competition See the other great ways dashboards can be used by checking out the BrightGauge Dashboardery.

[Podcast] Episode 20 with James Foxall of Tigerpaw Software

As the President/CEO of Tigerpaw Software, James Foxall keeps his sights set on industry trends, leading a growing team, and continually pushing to evolve the PSA platform. From the helm of the well-known brand, James has a unique view of ‘the biz’, so to speak, and we were excited to host him for a conversation about how he sees the industry now and where it’s going soon. From convergence strategies to recent PSA changes and consolidations, a closer look at what the Tigerpaw One platform offers for MSPs, and more, James shared an insider’s look into the world of technology solution providers. Trends in the MSP Industry: Episode Highlights An intro to James and Tigerpaw Software (0:58) The niche market that Tigerpaw focuses on (2:52) Why MSPs need to focus on a convergence strategy (4:15) A typical day as head of a software company (6:11) What is the Tigerpaw One platform and what does it offer to MSPs? (7:47) Getting the entire Tigerpaw team on board with a new platform (13:20) The biggest trend in the MSP industry (14:14) Typical Tigerpaw customers: employees, revenue, priorities, etc. (15:11) Tigerpaw One features & functionality that every customer should be using (18:07) James’ perspective on the recent PSA changes and consolidations (24:43) What happens at the annual Tigerpaw Conference (29:37) Rapid-fire Q&A: best business book, finding work/life balance, advice to other leaders, how to reach James or the Tigerpaw team (31:08) As mentioned in the episode: Books: The Breakthrough Company by Keith R. McFarland Lure the Tiger Out of the Mountains by Yuan Gao Want to find out more about The BrightGauge Podcast? Check out all the episodes here.

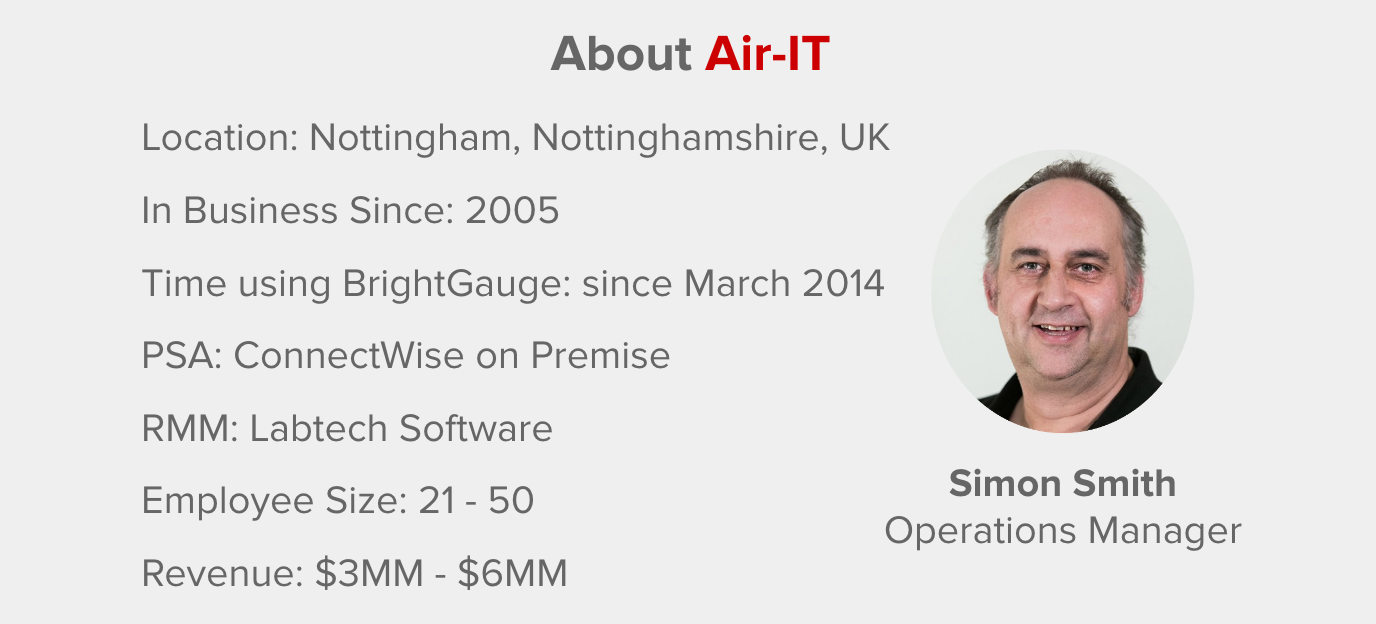
How Air-IT Stays a Step Ahead of the Competition with BrightGauge

[Case Study] Air-IT had been using another dashboard and reporting solution, lots of manual coding and “liberal doses” of Excel. They found that it was difficult to obtain accurate information and ensure information was based on the correct criteria. They also struggled to present the information to the team in a brief way and create reports that showed clients they were getting value for their money - without breaching confidentiality. Air-IT Operations Manager, Simon Smith, knew that getting accurate information in a timely manner was necessary to streamline their process and identify areas with the potential for improvement. Transparency is very important to Air-IT and Simon realized that in order to move the business forward, he would need to find a way to obtain and present accurate information in a way that didn’t take ages to compile. Adopting BrightGauge Simon believes in giving things a try before making a decision, so he began with a number of BI tools. BrightGauge came out on top after a process of “survival of the fittest”. Another reason Simon chose BrightGauge was because the helpfulness and responsiveness of our team. Simon says “Great support makes a lot of difference when it comes to getting the most from a tool.” Implementing BrightGauge and going through the onboarding process was “very easy” for Simon, and the number of gauges that were usable from the get go made it easy to get meaningful and accurate information. “If you know what you want to see, you can get started right away”, he adds. Simon also gives praise for BrightGauge’s support team, calling the support excellent, responsive and accurate. There hasn’t been a single issue yet that wasn’t completely resolved and he’s happy about the fact that he doesn’t have to wait weeks to get a response. Data customization was incredibly easy for Air-IT with graphs, tables and counts that could be customized with a simple drag and drop. Using the prebuilt gauges and default datasets, Simon has been able to pull some unique information out without needing to be a SQL programming expert. It’s been incredibly productive for him. Measurable Results Armed with real time information, Air-IT was able to immediately put themselves ahead of their competitors by delivering higher levels of customer service and satisfaction while increasing their profitability. According to Simon, “The best thing of all is that we we’re able to measure the effectiveness of our strategy and know it worked for us and our clients: a win-win!” In one example, Air-IT monitored the categorization of reactive tickets, and they were able to identify the issues which were the source of the most support calls, leading to a standardized solution: The management team at Air-IT have demanding requirements for performance information, so the ability to create dashboards with incredible ease that also show information in real time, and showcase more than one type of graph in reports was a big deal for Simon. As he explains: “We can see where the business is at pretty much in real time – this is information that takes competitors days to work out, and most of the time they don’t bother.” Recommending BrightGauge According to Simon, BrightGauge can be a game changer for both your operations and your strategy, but you’ve got to allow it to do that. It can be scary to put your real time numbers up for everyone to see, especially because those numbers are often sub par (when seeing them for the first time). Simon says that you’ve got to be honest with your team and yourself about the performance of the technical side of your business.

Service Management Best Practices [Free Webinar Download]

For our most recent webinar we wanted to feature a closer look at mastering the balance between efficient operations and ensuring customer happiness - a challenge for any SMB, yet a crucial step in the growth process. We asked Nick Olerud, Director of Technology at NetrixIT, to host this special session and share some of the insights that helped to first drive his team to improve and now maintain their performance. In Service Management Best Practices, Nick revealed some of the specific dashboards his team uses every day along with the management techniques that ensure success for Netrix. Some of the topics Nick covered: how to hold your team accountable with metrics and scorecards how he uses dashboards to manage projects and ensure his team is delivering on time using dashboards to manage escalation tickets leveraging BrightGauge to provide transparency to customers via dashboards and so much more! If you missed the live webinar session, you can still access the entire recording, plus the slide deck with Nick’s dashboard examples here:

[Podcast] Episode 19 with Shann Bosnell of CareWorx

As a true Power User of the BrightGauge platform, Shann Bosnell has joined us on multiple occasions to share some of the tools and best practices that helped TUC Managed IT Solutions (now CareWorx) grow exponentially over the last 10 years. This time we take a closer look specifically at the benefits of data-driven sales and service, results using client dashboards, the decision to operate in a vertical instead of a horizontal, and more. The Results of Utilizing Client Dashboards, and Data Driven Sales & Service: Episode Highlights Shann’s intro and a closer look at the evolution of TUC Managed IT Solutions (0:54) The business benefits of operating in a vertical instead of a horizontal (9:03) Advice on mergers and acquisitions: things to consider about your team in the due diligence phase (12:02) Roles and responsibilities as VP of Technology (15:35) Shann’s insights on where the industry is going & what service providers will be facing soon (19:52) Seeing huge growth by focusing on the right customers & MRR (23:32) Where did TUC’s data driven focus come from?... “Project Tangible” (24:10) Getting buy-in from the team on being data driven (27:47) How Shann uses his 3 key dashboards for customers, service, and sales {see them in the BrightGauge webinar on Customer Best Practices} (29:18) How to decide which customers get a dashboard (35:22) Using BrightGauge to uncover sales opportunities (38:39) Wrap up questions: best source of business knowledge, parting advice, how to reach Shann (40:31) Want to find out more about The BrightGauge Podcast? Check out all the episodes here.

New Dashboard UI Product Announcement

There’s nothing quite as exciting for us as an announcement about product updates, and this is a monstrous one! Last week we introduced several changes at once, so here’s the scoop on the new look and new abilities now found in BrightGauge: New dashboard settings menu New dashboard switching experience New feature of CLONING dashboards New feature of FAVORITING dashboards. New editing of dashboard names First, a quick video overview to demonstrate the new changes and then you can find more details about each below: Three Dot Menu - New Settings Menu Where there was previously a Dashboard gear icon and a “builder” state of a dashboard, we consolidated consolidated all dashboard functionality into a settings menu to the left of the dashboard name. The new look features a three dot menu. This three dot menu style has become very usable and popular within our community and we will be rolling this out throughout the rest of the pages when they get refreshed (and they will all get refreshed). Note: For our customers, when you press Add Gauges the same drawer pops out as before, but to close you can just press “X” Switching Dashboards Switching Dashboards got a major overhaul in this release. Instead of having a simple dropdown, we created a modal that has a search bar at the top. When you press “Switch Dashboards” from the new dashboard menu (or by pressing “s” key in the dashboard) the cursor will already be in the search bar so you can start typing and just hit the arrow key down to find your dashboard... Super fast and efficient way to change dashboards. The modal is organized by favorited dashboards first (new feature!!!) and then rest of dashboards in alphabetical order. Favoriting Dashboard As described above, the switch dashboard modal is organized by favorited dashboards first so those are easiest to find when looking for dashboards. You can favorite a dashboard by going into the settings menu of the dashboard and clicking favorite! Very easy, very functional. And these are personal favorites so they are only visible to you. Cloning a Dashboard A big feature request from our users was to more easily create multiple dashboards similar to each other. So we decided to add in the ability to CLONE a dashboard from the dashboard settings menu. It works just as you would think, click to Clone, give it a name and the new dashboard is created with the same gauges as before. Editing Dashboard Name In-Line Lastly, when creating a dashboard you will be first prompted to give your dashboard a name. Not to worry though if you want to change the name later, you just hover over the name of the dashboard and and click to edit (very similar to the Report Builder). The dashboard name will save once you press the enter key or just click on any part of the app. That’s a wrap, lots of new features and consolidation of features in one release. Stay tuned for more changes coming soon to the dashboard!

Our Latest Content

// Siteimprove tracking