Blog Logo-2.svg

The BrightGauge Blog

How TUC Builds Customer Relationships through Transparency

[Case Study] Ask anyone who has been in the Service Provider game for a while about reporting capabilities, and without a doubt you’ll hear that most of the PSA vendors don’t provide a lot of ...
[Case Study] Ask anyone who has been in the Service Provider game for a while about reporting capabilities, and without a doubt you’ll hear that most of the PSA vendors don’t provide a lot of flexibility. Yes, there are some standard options available but ‘standard’ options always have limitations. As it is, the Executive team at TUC Managed IT Solutions found themselves frustrated with their lack of choices shortly after the switch from NetSuite to ConnectWise a few years ago, not only because of the reporting limitations but also because the customer portal didn’t offer the visual appeal that TUC prioritizes as an integral part of any business application. Looking for a Solution It was not too long after the switch to ConnectWise that Shann Bosnell, TUC’s VP of Technology, attended IT Nation where he saw a BrightGauge demo by our co-Founders, Brian and Eric Dosal. Shann was in the market for a reporting solution that would offer visual appeal and ease of use, but he also realized that the only time a customer-facing solution would make sense is if his customers could also see the value in the service he provides. After speaking with the Dosals, Shann realized that the platform would solve a number of the issues that TUC was facing. Right then and there, Shann decided that he would utilize BrightGauge to manage the data he needed at his fingertips. After working with the BrightGauge team to ensure a proper setup and that information was being captured from both ConnectWise and LabTech, the TUC team was ready to get started with their new data solution. Building customer relationships through transparency Before BrightGauge, TUC’s reporting options left the team so frustrated that they decided to skip reports all together. After getting started with BrightGauge’s earlier version, the impact was immediately noticed and the results helped to set the stage for what TUC could offer their customers. Shann and his team had the ability to create impactful, actionable reporting that would show customers what work was being performed and the time and effort TUC was saving them. With the launch of BrightGauge’s newest release, 4.0, and customer dashboards, TUC now has the ability for their customers to see specific information that is important to them... in real time. Shann’s team started by offering reporting and dashboarding to one of their main customers; when the feedback proved the customer was blown away with the capabilities the team knew they had a way to solidify all of their business relationships. These days, TUC has 7 people creating reports and each person averages 2-3 hours spent each week producing them. Since reporting is now a priority, TUC hears that their customers are significantly happier based on the transparency they can offer. Whether results are good or bad, customers can easily see which parts of the business relationship are strong and which parts need improvement. As Shann explains, “this helps us be a better company each day.” Recommending BrightGauge “In the end, any tool is only as good as the development being put into it and the support you get, when you need it. BrightGauge is always in development. New benefits are coming monthly from my investment. Every time I’ve had to reach out to support they truly do meet 3 important parts of support I look for. 1 – Quick response. 2 – Empathetic to the situation. 3 – Offer a solution. It is for these reasons that BrightGauge is our chosen partner.”
request-a-brightgauge-demo

New Client Reporting Templates for Connectwise, Autotask and Tigerpaw

What service information should I send my clients? How often should I send the reports? These are the two most popular questions we get during the on-boarding process with new customers or when customers are initially setting up our Client Reporting feature. The good news is that we have you covered! We’ve already done the homework on the key information you should be sending your clients by providing you with templates per data source. It’s important that we discuss how we developed these templates. We used three techniques: (1) analyzed the client reporting features of our power users (2) surveyed our customers and (3) leveraged our own experience from our MSP. What came out of this 2-month long research project are our Client Reporting Templates, which we have shared with all customers. But it’s important to note that these are a “starting point” to help you get going. From here you can build more customization or make adjustments as you see fit. For our PSA data sources, Connectwise, Connectwise Hosted, Autotask, and Tigerpaw we focused on just a few simple gauges: Service Summary This shows tickets that are currently open, tickets opened last month, and tickets closed last month. This gauge is a great snapshot into the services details for the prior month. Open vs Closed Tickets This gauge is a perfect visualization into how your team is keeping up with the demands of the client. If there are more tickets open than closed (meaning your service backlog is increasing), then there should be a point of discussion with your client on how you can address this. Service Level Agreement (SLA) If your data source provides SLA information that allows us to document the average time it takes to acknowledge or respond to a ticket, it’s important to share that with your client. This shows that your team is being responsive to their requests which is one of the most important characteristics a client expects of a service provider. Tickets Opened By Type This pie chart shares the type of tickets your client currently has open with you. This gauge provides a wealth of information on what type of work your client is requesting of you. One glance at this gauge tells a story of the different types of support you are providing - and if the support is off, what’s expected based on the contract. This is your opportunity to review with the client and make adjustments. Most Active Users This is one of my favorite gauges to share with clients because it helps immediately identify the “problem users” that may need some extra coaching or training. We all have a few noisy users in our client base who have a tendency to open the majority of the support requests, and this gauge allows you to bring it front and center. In summary, with these 5 key gauges you’re able to show: All the work you have done for the client How you’re responding to their requests Whether your team is keeping up with the volume The type of support you are providing The most active users that you’re spending the most time on This summary speaks volume about the value you’re providing! To learn more about how you can ensure client happiness and save a ton of time by skipping the manual report process, check out our free webinar:

Subscribe to get the latest content delivered to your inbox

[Podcast] Episode 3 with Matt Gallo of United Data Technologies

After we recently featured a podcast about the BrightGauge sales process, the feedback was great from our community but folks still had questions and wanted to dive even deeper into the topic. So we invited Matt Gallo, Territory Sales Manager of the SMB Division of United Data Technologies (UDT), to join our co-Founder and CEO, Eric Dosal, for an in-depth discussion about his experience building a sales division for one of the largest Managed IT teams in South Florida. getting ready to kick off Episode 3 of The BrightGauge Podcast With a background in IT Sales at Compuquip and All Covered, Matt made the leap into Sales Management when he transitioned to UDT. During his conversation with Eric, Matt explains in detail how he ensured his success in the new position and offers insight into building a MSP sales division from scratch, keeping his team focused on hunting new business, the candidates he looks for in the hiring process, how to compensate a sales team to make sure they stay focused on bringing in the right business, and so much more! Building a Sales Team: Episode Highlights Sales team compensation (8:48) The transition from Sales to Sales Management (13:49) Hiring a Sales team (15:58) A typical day in Sales Management (17:16) Hunting new business & building business relationships (19:25) Sales tools (25:24) No easy way out (26:35) Fun Q & A (27:44) If you’re in charge of managing a sales team or even considering the next steps in your sales career, you’ll want to hear Matt’s advice based on years of experience in Managed Services! Want to find out more about The BrightGauge Podcast? Check out all the episodes here.

Top 4 Reasons Why You Should be Sending Reports to Clients

Brian and I have been on this kick of meeting with customers and learning more about why they use BrightGauge and what areas we can improve on. As we started with our larger partners that had been with us for a while, we noticed a trend. All of them were using our Client Reporting and we wanted to understand why. So we asked them for some insight and here’s what they said as to why they send reports to clients on a monthly basis. Turns out there are 4 recurring reasons or themes we have heard in our conversations: 1) Staying Top of Mind With My Clients This was by far the most popular response in that sending your client a report on a regular basis, with meaningful information, they are able to stay top of mind. This is a low impact way to make sure your clients know all the wonderful things you’re doing for them and also that you are regularly keeping an eye on their technology. 2) Showing the Value You Provide This is a big shift in the way traditional MSPs think because many of them are just focused on the speeds and feeds of what they do... not on all the value they bring to their clients. During the conversations we had, it was clear that these partners understand the importance of showing value and more importantly to convey this value in a non-intrusive way. Most of them found that sending a regularly scheduled report with everything accomplished is a huge help in articulating their value. 3) Providing an “Itemized Receipt” for Everything You’ve Done This was a unique one for me, but it made total sense after they explained it. We all have eaten out at a restaurant and at the end of a meal you always get an itemized list of everything you consumed during your meal. The receipt serves as documentation for everything that was provided to you and explains why your bill is the price it is. Same goes for your clients, sending them a report shows all the things they have consumed (or you have done) and reminds them why they have to pay the bill. 4) Historical Records and Documentation Monthly Executive Summary Reports are a great way to document everything happening or what has happened over a given time period. The beauty of reports is they are from a specific point in time which serves as a great source of documentation. Saving this historical information comes in handy to reference in the future and especially in the event of an audit where you need to provide the information upon request. To learn how Client Reporting can make a huge impact on your business, download our free webinar where we share how Client Reporting is a key pillar in the area of Customer Success.

Tips on Identifying Your Ideal Customer [FREE Webinar Download]

Finding the right customers begins during the sales process, but why is it important to find the right customers? More importantly, how do you spot a bad customer in the sales process? We know the sales process topic can be overwhelming… with so many ideas and opinions out there, it can be hard just figuring out where to start. So we invited Richard Tubb, one of the most well-known consultants in the British Managed Service Provider (MSP) business, to speak with the BrightGauge community about choosing the right customers for a Service Provider business. During the 50-minute discussion with our co-Founder and CEO, Eric Dosal, Richard gives first-hand advice from his days as a MSP Owner. From bad customers to budgeting woes, placing price over value or lack of communication, Richard has dealt with all the challenges that are so common in the Service Provider industry. You’ll walk away from the webinar with new ideas on how to address each issue, whether you’re the MSP Owner or the person in charge of Sales. The topics covered include: Understanding the different types of customers How to spot a bad customer in the sales process Finding a customer's budget and so much more! To download, click the image above or this link.

70+ Metrics for MSPs

Key metrics and accompanying formulas to help MSPs skyrocket growth and success!

Get your KPIs

[Case Study] CadreNET saves 25 Hours per week using BrightGauge

In the beginning, CadreNET was manually producing reports along with using built-in dashboard functionality from their PSA, Tigerpaw. They lacked an efficient way to produce internal reports, monitor their business or even make metrics-based decisions. Owner Richard Trivedi found a solution using BrightGauge to monitor not only his business, but his team as well. Needing a Consistent Business Update As a Managed Service Provider, it’s critical for CadreNET to process data quickly and accurately. But when it came to their built-in software resources at hand in Tigerpaw and Kaseya, they were missing a way to tie all their metrics into one easy-to-monitor resource. The management team was left to manually produce timesheets, income reports and more - a serious time commitment for a team focused on growing their business. With 12 metrics to check and a processing time of 10-15 minutes per metric, the minutes quickly turned into hours for each status update. Furthermore, they found that when they did run reports from their softwares the data was often inaccurate and never gave them the right figures. Building a Data Process As Richard immediately realized, he and his team were desperate for a dashboard solution that would keep them up to date throughout the day with real time data. After realizing that BrightGauge did not yet integrate with Tigerpaw, Richard evaluated other solutions in the market but was very disappointed by poor follow-up and customer communication when installations failed on deployments. After this frustrating experience he decided to put the project on hold and revisit in the future. Within a week of moving on, Richard received an invitation to be a Tigerpaw Beta tester with the BrightGauge team and instantly volunteered to help. He found the setup to be very simple: with our standard instructions plus a quick introduction call from our team, Richard was up and running by himself in less than 10 minutes. The BrightGauge Experience Using the BrightGauge platform, Richard now has real time information in front of him that helps significantly when it comes to making business decisions. Being able to monitor time entries made by his team also gave Richard access to tracking their performance, greatly reducing missed tickets entered into Tigerpaw. At roughly 10% of billable tickets being lost prior to BrightGauge, the money reclaimed moving forward was a notable win. But besides the money gain, Richard noticed an even larger feat when it came to his time savings. By using the BrightGauge gauges and dashboards as compared to running reports himself, Richard saves an average of 20-25 hours each week. Recommending BrightGauge “There are many reasons [to recommend the platform] but product performance and support are always the two main reasons, and BrightGauge has surpassed my expectations on both. My most positive experience has been working with the team - they are top notch and always willing to help. I was extremely pleased with the product and team from Day One.”

Free Webinar: How Investing in Customer Success Drove Our MSP Growth

Join us on September 22nd at 11:00am EDT to learn about How Investing in Customer Success Drove our MSP Growth. In this 45-minute session, our co-Founder and CEO, Eric Dosal, will guide you through a closer look at why Customer Success is a key factor in the growth of any Service Provider business. As the former owner of a MSP business, Eric knows first hand about the need for account management and exceeding a customer’s expectations. He’ll open up his personal playbook and discuss the steps and the data that were behind each decision he made while managing to grow his MSP into one of the largest in South Florida. During this discussion, Eric will cover several topics that are essential to implementing and managing a Customer Success program, including: What is Customer Success? How Customer Success Impacts Churn Key parts to a winning Customer Success process What should a Customer Success person/team look like Customer Success KPIs Open Q & A and much more! You’ll walk away with actionable insights on the steps you should take to kick off a Customer Success program, whether you’re the MSP owner or the person in charge of Sales. We hope to see you at the next session in our ongoing BrightGauge Educational Webinar Series! To RSVP, click the image above or visit: How Investing in Customer Success Drove Our MSP Growth.

3 Ways BrightGauge Helps Keep Your Clients Happy

"Why do I pay you every month?" The dreaded question of any service provider. So how do you combat receiving this potential question? According to Harvard Business Review, it can be up to 25 times more expensive to constantly acquire new clients instead of keeping your existing clients on board by ensuring their happiness. And, more than 50% of customers switched service providers in a single year after poor customer service according to Accenture’s Global Consumer Pulse Survey. Sounds like the obvious approach is to make sure you have happy clients. Based on the stats, we decided to spend a few weeks meeting with our fastest growing partners. We uncovered 3 key reasons why they are using BrightGauge to keep their clients happy and engaged. Sharing That You Provide Top Notch Service Become a True Partner, Not Just a Vendor Show Them The Information They Want, When They Want It Sharing That You Provide Top Notch Service At the end of the day we are all in the client Service business and you as a MSP just happen to use technology to provide that client service. Your clients are counting on you to provide the very best support possible and expect you to deliver on what you promised. By sharing with your client all the tasks you have accomplished during the previous month it allows you to highlight the tactical impact you have on their business. Become A True Partner, Not Just a Vendor Technology is at the center of everything we do and as MSPs you provide an incredible service that enables companies to function on a daily basis. Our partners prepare and deliver their client’s reports and use that as an opportunity to have conversations with the decision makers on how their technology is performing. These conversations allow you to “Move Up The Stack” which is one of the key lessons we shared in our Sales Best Practice Webinar. Show Them The Information They Want, When They Want It Your clients are already getting bombarded with emails and status updates from every vendor, partner, software, company they interact with. So a great way to differentiate yourself is to customize the information you are sending your client and the frequency that they receive it. By taking the time to understand what they are looking for and provide them that information when they want it, it will make you stand out above the crowd. To learn how Client Reporting can make a huge impact on your business check out our free webinar where we discussed how Client Reporting is a key pillar in the area of Customer Success.

Launching The BrightGauge Podcast

The team at BrightGauge really prides ourselves on being open-minded, especially when it comes to new ideas about how we can share content with our customers and friends. So during the course of a round of recent customer feedback interviews led by our Product Manager, Brian Dosal, I took note that a few of our customers referenced podcasts they listened to or had even been featured on. Around the same time our CEO, Eric Dosal, happened to mention a possible BrightGauge podcast by coincidence. Armed with the customer feedback, a mutual passion for sharing information and a complete lack of marketing inhibition, the conversation was short and the excitement was high. We were going to launch The BrightGauge Podcast! Since we’ve always had a lot of ideas for content to share with our community, having another platform to do so was an obvious choice for communication and education. Welcome to the show [Cut to a few weeks later] With topics laid out, a recommended podcasting microphone on deck and a little research under our belts, we were ready to introduce ourselves to the world. Episode # 1 featured Eric and I explaining how and why BrightGauge was founded and where we are going in the near future, as well as our company and team growth over the last few years. Episode # 2: The BrightGauge Sales Process We’re constantly speaking to MSPs and ITSPs from all over the world. While time zones and accents change, the challenges seen by each one are usually parallel and one of those challenges is how to implement or improve a sales process. So, what better way to begin giving some insights on the topic than to open up about what works for us in the BrightGauge sales process? We called in our expert, Larry Garcia, our Director of Sales, to share some tips and actionable insights about his sales pipeline. From using storytelling in the sales process to helpful sales tools and even how to process a cold lead, Larry lays out his best advice in this episode. We hope you enjoy the latest episode of The BrightGauge Podcast, and don’t forget to send us your ideas for topics to be covered on future episodes! I can be reached at amccluney[at]brightgauge[dot]com for suggestions. Episode 2 Resources: Spin Selling by Neil Rackham The Joshua Principle by Tony Hughes Predictable Revenue by Aaron Ross Software: CirrusInsight.com Want to find out more about The BrightGauge Podcast? Check out all the episodes here.

Tigerpaw Expansion Offers Opportunity, Invoice, Task & Quote KPIs

Today we’re excited to share that BrightGauge has announced 24 new KPIs for our Tigerpaw partners, helping make a great product even better and bringing the integration to a whole new level. We announced our original integration earlier this year with an initial focus on Service Orders and Time Entries data. This included the release of our Tigerpaw Best Practices Dashboard (shown below). But upon further investigation of the Tigerpaw Software and initial feedback from our Tigerpaw Partners we knew we had only scratched the surface of the data they need to run their businesses and decided to dive into Opportunity KPIs, Invoice KPIs, Task KPIs, and Quote KPIs next. Below is a list of all the new KPIs we released including a few screenshots of the most popular ones. To learn more about our integration please visit: Tigerpaw Integration Overview and for our existing customers that want assistance on how to customize these metrics please reach out to our Data Team. Opportunity KPIs Opportunities Closed Last Week Open Opportunities By Type Open Opportunities By Stage (pictured below) Revenue Pipeline Next 30 Days (pictured below) Revenue Opportunities Currently Open By Sales Rep Invoice KPIs Invoices Paid Last 30 Day by Account Invoices Paid - Last 30 Days Outstanding Invoices Count Outstanding Invoices By Account (pictured below) Outstanding Invoices Total Amount Trailing 12 Month Revenue (pictured below) Total Revenue Amount Last Month Outstanding Invoices by Aging Status Top 25 Balances Due by Account (pictured below) Task KPIs Open Tasks (pictured below) Open tasks Past Due (pictured below) Open tasks by Member Open tasks Past Due by Member (pictured below) Open tasks by project Open tasks by opportunity Quote KPIs Open Quotes Open Quotes By Rep Open Quotes By Status Open Quotes By Account

How BrightGauge Works: A 30,000-ft view

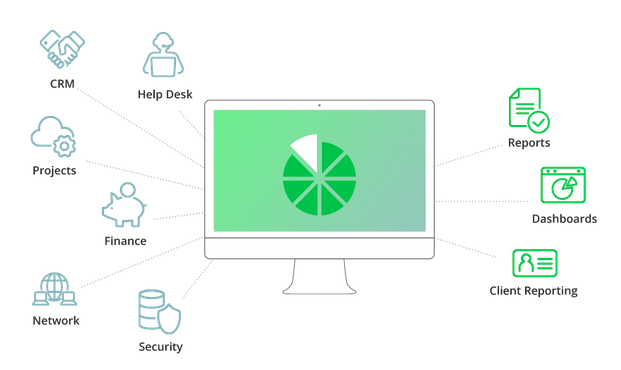
What is BrightGauge? BrightGauge is a web based application that serves as a data visualization and centralization tool for your current PSA, RMM, and Finance software(s). We help you get the most out of your data source(s) by accessing, grouping, and simplifying data that most of these tools have “hidden”/stored in their databases across multiple tables without a simple way to display or report on. Apart from accenting each software individually, BrightGauge allows you to bring together multiple data sources into our platform, whether it's an on-premise system with our secure agent or connected via an API to a hosted provider. These tools are typically built as silos with limited interoperability. Each has its unique strengths, but they keep their proprietary content “locked” internally, leaving gaps and incomplete coverage in your business. We help you break down the barriers of these data silos and bring all your key business data together. In order to help you leverage your data, there is a three step process from your datasource to the end result visualization that we will define now and explain later. The key definitions are: Datasets - The Raw Data we extract from your datasource, normalize a bit (like dates), and then make available to you to create visuals. Gauges - These are the visualizations of the data. The charts, numbers, lists, or tables that are created as representations of the raw data. Reports & Dashboards - These are the areas where you can place your gauges for regular viewing. Now that you have that basic understanding, read below for key differences and more detailed definitions of each of these terms. Datasets vs. Gauges Datasets and Gauges are what power the BrightGauge app; datasets serve as a backbone while gauges serve as a brain per se. Gauges use these fields to display information in the form of several charts such as tables, vertical bar graphs, line graphs, horizontal bar graphs, pie charts, number headings, lists, and tables. Dashboards vs. Reports Dashboards and Reports are both tools that are built off of Gauges and are used to group, display, and share data. Just like Gauges, Dashboards and Reports are customizable and can be tailored to best fit your needs.

Our Latest Content

// Siteimprove tracking