Blog Logo-2.svg

The BrightGauge Blog

Tips on Identifying Your Ideal Customer, with Richard Tubb

Join us on August 27th at 10:30am EDT (3:30pm BST) for Tips on Identifying Your Ideal Customer. During this 45-minute webinar our co-Founder and CEO, Eric Dosal, will be joined by Richard Tubb, one ...
Join us on August 27th at 10:30am EDT (3:30pm BST) for Tips on Identifying Your Ideal Customer. During this 45-minute webinar our co-Founder and CEO, Eric Dosal, will be joined by Richard Tubb, one of the most well-known consultants in the British Managed Service Provider (MSP) business. As the former owner of a MSP business, Richard understands the challenges IT business owners face every day and can help you to overcome them while retaining what's left of your precious sanity. We’ve worked with Richard on other topics in the past (Internal Metrics that Matter for MSPs) and the feedback was excellent, so we knew it was time to bring him back again for an in-depth discussion on a challenge that many Service Providers face - how to choose the right customers for your business. During this discussion, we’ll cover several specific topics so that you walk away truly understanding which customers deserve your precious time and energy: Understanding the different types of customers Red flags in the Sales Process How to spot a bad customer Finding a customer’s budget and so much more! Whether you’re the MSP owner or the person in charge of sales, you’ll walk away ready to implement proven techniques from an industry veteran. To access the webinar recording, click the image below or visit: Tips on Identifying Your Ideal Customer.
request-a-brightgauge-demo

3 Benefits of Using Dashboards as a Sales Tool

As a newcomer to the world of software and IT Services, I knew when I accepted the Inbound Marketing position at BrightGauge that it would be an incredible learning opportunity. So when our co-Founder and Product Manager, Brian Dosal, suggested that I participate in a few customer feedback calls I was excited to learn more about the benefits each customer sees - besides the obvious solution for creating reports and visualizing data. Nearly every customer we’ve spoken to so far has mentioned that they would love to know more about what their colleagues are doing with BrightGauge dashboards (point noted by yours truly). As I was taking notes and letting it all sink in, there was a pattern I noticed within the first few calls and I have to say it took me a bit by surprise. Our customers are making great use of Dashboards as a Sales Tool when signing up new clients for Managed Services. So in the spirit of kicking off our new efforts to share customer success stories, here are the 3 Sales Benefits the BrightGauge community sees as a result of having their dashboards on display: Quality Control Potential clients want to know how a MSP keeps tabs on the criteria as outlined in their contract. Think about it. Who comes to these Service Provider facility tours and makes the decision to sign up or keep looking? Chances are it’s a C-level group: folks who are up to their eyeballs in meetings, emails, paperwork and phone calls. With dashboards in place, it’s easy to keep a pulse on what’s happening and make any necessary changes in real time. It shows that a Service Provider is committed to tracking and maintaining performance and also ties into the time agreement of the SLA. Differentiation from the Competition In today’s market with so many options for IT Support it's important to stand out in the crowd and show your prospective customers you are different. Having dashboards up in your office shows that you take your service seriously and that you are on top of what your team is doing. You would be surprised at how often we hear this is a factor in a prospective client’s decision making process. Aesthetics Let’s be honest, it’s human nature to be drawn to things that look good and please our eyes. We’ve heard several of our customers say that while giving office tours to prospective clients, having dashboards on display helps with the vanity factor. They look cool, and having TV displays offers a modern take on the old spreadsheet charts and graphs from years ago. Dashboards impress those same execs because the data is current and updates every few minutes. Nucleus Networks displays several dashboards throughout their office It’s exciting to be able to share new ideas within our community, so I hope you’ll stay tuned as I continue rounding up notes from our customers about ways they’re using BrightGauge. Oh, and if you have an idea or a beautiful dashboard photo to share with our community? I can be reached at amccluney [at] brightgauge [dot] com. Want to learn more about Sales Best Practices? Hear about the lessons our co-Founder and CEO, Eric Dosal, learned while growing his MSP practice 10x in 5 years [free webinar download]:

Subscribe to get the latest content delivered to your inbox

Adam Merille joins BrightGauge as Web Developer

We’re thrilled to announce that Adam Merille has joined BrightGauge as a Web Developer! The younger years As a Miami-area native, Adam spent his first university days at Miami-Dade College, where he graduated from The Honors College with a focus on Anthropology. After graduation, the world was calling to be explored so Adam took six months off and used that time to travel around southeast Asia in Thailand, Laos, Vietnam, Cambodia and Burma. It wasn’t long after his return that he felt the need to continue his studies and so he enrolled at The University of North Carolina where he would major in Global Studies with a focus on Asia and minor in Religious Studies. During this second school phase, Adam also participated in a study-abroad program allowing him to live in China for a semester. After his days at UNC, Adam accepted a job with Fidelity Investments as a Financial Representative, but realized after a while that it wasn’t his calling, so he resigned with a decision to learn more about programming. After some initial learning on his own, Adam enrolled at Florida International University for Computer Science. He studied a lot, signed up for any internships that came his way and even worked with BrightGauge on his senior project. Long story short, he is now the freshest face on the BrightGauge team! Looking to the future at BrightGauge Adam tells us he is excited to work with our team because we have fun while working hard. While he was looking for an opportunity to learn more about web development, he specifically chose BrightGauge as his home because of our company culture and because we have “a product that people love and the company is always trying to make it better” (we couldn’t agree more). Plus, working in a small company gives Adam much more exposure into the different aspects of the business while also enabling him to contribute in ways outside of the standard job description. Behind-the-Scenes scoop Outside of our office, Adam is most likely to be found reading books/articles, watching movies or of course traveling the world. Besides his stops in Asia, Adam has also spent time in Turkey, Austria, Costa Rica, Nicaragua, Belgium, Guatemala and more. It’s safe to say that Adam loves trying new food and experiencing different cultures, whether he’s out leaving his mark on the world or right here in his hometown of Miami. Please join us in welcoming Adam to the BrightGauge team!

5-Point Checklist: Hosted vs. On-Premise BI Solution

Let’s face it, the cloud is here to stay! And I can really feel a big shift within our customer base as the cloud becomes more prevalent in small to medium businesses. Back in 2013, when I was doing every demo before we had a rockstar like Larry Garcia on board, answering questions about BrightGauge being a hosted platform was commonplace. Flash forward to today, and in the conversations we’re having now with prospective customers, the topic of hosted being a negative rarely comes up. As a matter of fact people see it as a huge benefit. We are no longer having to deal with objections because we are a hosted provider and can jump right into how we can make an impact on our customer’s business. Here are the Top 5 benefits we hear from our customers about using a hosted platform: No Overhead to Manage When you leverage a hosted solution, it limits the overhead (physical and personnel) that you need to deploy or manage. The days of having an on premise solution where you need to download an application and load it on a device physically in your office are way behind us. Not only does that take a ton of time to deploy but then it’s another piece of hardware/software you need to manage. As a small business, the less you need to deal with the better. Lower Costs: Implementation & Ongoing The pure nature of not having to manage anything locally on your network means you are bringing the cost to implement the application down. With no hardware to buy and no servers to purchase and set up, you’re also saving money on the labor hours for installation. When it comes to the ongoing maintenance and upgrades required for software, a subscription-based service will save money because there are no patches to install and no IT resources required since maintenance responsibilities fall to the service provider. If you need more proof about the cost scale, don’t forget that a quicker implementation means a quicker Return on Investment. Hosted solutions can often be up and running in days or weeks, compared to the old-school traditional implementations which can take months on end. Security of One vs. Many One of the breakouts I enjoyed at the Gartner conference earlier this year was around the cloud and security. I’m not suggesting the cloud is 100% secure but cloud providers have a lot more to lose and lot more resources to dedicate to security because they are protecting many customers, not just you. So you get the benefit of their expertise without having to deal with it yourself. Scalability Leveraging the infrastructure of a hosted provider allows you to tap into their ability to scale up (or down) as needed. Most Software as a Service (SaaS) providers make it very easy to scale their platform to meet the needs of their customers. At BrightGauge we pride ourselves on the ability to offer a solution that meets the needs of a small company with less than 5 employees but also scale to meet the needs of our larger customers with 200+ employees. Easy Sharing With an internet-based solution, users can easily share their data. So whether they’re working with a customer, on a team project across multiple office locations or even with a teammate in the field, location will never hold back sharing capability. It’s a fact. The cloud is here to stay (along with hosted software platforms) and will only continue becoming a more regular fixture in our technology stacks. When it comes to selecting the best BI solution for your company, my advice is to start comparing your choices based on these 5 key business benefits. Once you can weigh the pros and cons of overhead, costs at hand, security, scalability and ease of sharing, you’ll be able to select the best match for your software needs.

Introducing our Data Customization Team

If you’re a regular reader of the BrightGauge blog then you know we’ve been making a lot of investments in our team lately. Since April we’ve grown from 7 employees to 12 full time plus we’re looking for lucky #13 (Front End Developer). This was a decision Brian and I felt was critical to make now as we felt the timing was right to take the company to the next level. So we hired Kristian in Support, Lisette in Support (short term), Amanda in Marketing, Jason in Product Design, Adam in Product Development and promoted Larry to Director of Sales and Orlando to Director of Engineering. One of the most exciting investments we made was our newly established Data Customization Team made up of our former Support Guru Randall Berg and a new team member Rick Aquilia who joined us in May. The Data Customization Team’s one and only mission is to help our customers get the data they need the way they want to see it in BrightGauge. That’s it! Why Invest In Data Customization After doing an in depth analysis of why customers end up leaving us, we found the biggest reason is “No Time To Implement / Not Using” (spoiler alert: this is usually the top reason any SaaS company loses customers). Rather than accepting this as a norm we decided to ATTACK this challenge and help our customers get fully implemented. We know data isn’t a “one size fits all” and as much as we build templates and default gauges, reports, dashboards it’s never enough. Everyone still needs a little customization here and there. Well now we are staffed up and ready to handle this type of customization. What we learned from talking with our Customers As much as we try to automate, implementing a data analytics solution isn’t “plug and play” and still requires involvement from our Customer. Our most successful customers are the ones that from the moment they start with us get BrightGauge fully implemented and customized the way they want to use it. The larger customers tend to have resources that they can dedicate to setting up BrightGauge versus the smaller customers who typically rely on our templates and defaults. Upon learning this we decided to make data customization available to every customer no matter whether they have the resources or not! They are with you from the beginning... Upon signing up with BrightGauge you will be assigned a dedicated implementation manager. This person is your single point of contact to get BrightGauge up and running. We don’t just send you online documentation and make you wait in a support queue. Your implementation manager will work with you to make sure you get data flowing properly and then schedule time with you to provide one on one training and any customization you may need. And available for you at any time... As you get more and more familiar with BrightGauge you may want to make additional changes or add additional customization and our team is here to support you. If you have any questions related to your data, inaccuracy in what you’re seeing, ideas you want to implement and don’t know how, or maybe just to discuss any new best practices we have released, this team is standing by to help. And we limit the investment you have to make to work with them... A popular question we get is around the cost to engage our Data Customization Team, and the answer is: there is ZERO COST to engage with our Data Customization Team. Full disclosure, the team is focused on customizations of your current set up but we do have limits and if you’re looking for some very unique customization or heavy SQL work we’ll have to engage our Professional Services Team. The good thing is we don’t do any work (billable or not) without your approval so as you come up with ideas please let us know. The entire BrightGauge Team is committed to making our customers successful by helping them tackle business problems through leveraging their data. This is just one of the new and exciting ways we’ve implemented to make this happen. If you want to learn more about how our Data Customization Team can help you, please reach out to us via support and we’ll make sure to set up a call with you.

70+ Metrics for MSPs

Key metrics and accompanying formulas to help MSPs skyrocket growth and success!

Get your KPIs

Productivity Hack: How to Save Time with Dashboards

Time. It’s one of those elusive things that nearly every adult has on or near the top of their wish list. Along with trees that grow money and the fountain of youth, having more time in a day is like the grown-up version of a fairy tale. And since we don’t have any fairy godmothers hanging around to help cross those wild wishes off the list, we decided to focus on the tangible way to help save some of those precious hours during your workday - by using dashboards to manage your data. If you work in the IT Services industry, you know first-hand how much information and analysis is at stake when it comes to tracking open and closed tickets, servers online vs. offline, workstation disk space used, and the list goes on… all tying back into an SLA in many cases. So if you’re the one in charge of providing updates to your team and making sure everyone is on the same page, you understand the pain of logging into your RMM or PSA to run reports. Enter dashboards. On the rise in popularity over the last few years, dashboards are a huge time-saver because they give you, as the user, an automated and streamlined way to process huge amounts of data. But they aren’t just for making it easier to pull data. So popular are dashboards in all aspects of business, that Fortune recently featured an article full of advice from the acclaimed entrepreneur Verne Harnish about leading better meetings by using “...dashboard technology to keep up with the progress of projects in real time so you can devote your meetings to debate and decision-making…” Dashboards can also help companies save time by using the information at their fingertips more effectively. Each user has an overview of data at a glance, but one click gives them the ability to drill down into each metric or chart for more details. With a closer look at the information at hand, it’s easier to see negative trends and address them quickly. Aside from the time savings in a management and reporting perspective, dashboards will also enable your team to be more efficient. Your Sales team may be using dashboards to track how many more clients need to be closed to hit their goal for the month. Then your Service team will need a closer look at how many tickets are outstanding and which ones should be addressed first. While dashboards displayed on televisions around the workspace may look pretty awesome, there’s science behind using images to make faster decisions - the human brain processes an image 60,000x faster than reading text! Now that’s some food for thought when it comes to using images for data visualization!

The Dashboardery: A Collection of Dashboard Configurations

One of the most popular questions we get from our customers and prospective customers is “what metrics do you recommend?”. That’s such a difficult question to answer because the reality is, it all depends on the questions you’re trying to answer and goals of your business. That being said we still want to be able to share some ideas from our customers with our community, so in order to help with that we have put together the BrightGauge Dashboardery. As you can see, we give you the ability to filter down the samples based on your role within the company, the data source integration, or you can just view the templates we have to offer. Our goal for The Dashboardery is to be a single place of inspiration for dashboard and metrics ideas. Have an awesome dashboard that you want to share with the BrightGauge community? We love to see our customers giving each other advice on the metrics they like using best and how they have designed their dashboards using those metrics. Just send us a screenshot of your dashboard and we’ll take care of the sharing (plus we’ll return the favor by sending you BrightGauge swag). The Dashboardery also allows us to show “what’s possible” with BrightGauge and gives our customers a jumpstart on ideas to get the most value from their data. From our research with customers, the most popular dashboard use cases are for tracking KPIs, setting up threshold alerts using color-changing gauges to identify areas to address, or even increasing competition/performance within the team. As an added bonus, we have even heard from a few of you that having the dashboards hanging on your wall results in extra credibility when potential new clients stop by to take a tour. Clients love to see the quality control aspect of monitoring data with a dashboard in real time. Not a bad way to help close the deal when prospects are comparing service providers! So what are you waiting for? Take a look at some of the dashboard examples here and start getting inspired. When you’re ready to share your creation, you know what to do! July 2018 Update: We're working on a new Dashboardery tool and will have a new version up soon. In the meantime, checkout more information on BrightGauge Dashboards here.

Rick Aquilia joins BrightGauge as Customer Success Specialist

BrightGauge is excited to welcome Rick Aquilia as a Customer Success Specialist! The Story Begins Like many folks who settle in south Florida, Rick grew up in New York as a resident of Long Island. After attending LIU Post, Rick joined Piping Rock Country Club where he spent time serving, bartending and most importantly fixing issues with their less-than-stellar computers. He moved to south Florida with his sights set on breaking into the software industry and had even heard about an opportunity at a growing, family-owned SaaS company. A New Chapter Rick initially joined our team as part of a short-term project, but he quickly proved that we needed him on board full-time at BrightGauge. He’s excited to be part of the team as he continues learning the industry and also “helping to push BrightGauge to the next level!”. As a Customer Success Specialist, Rick will spend the majority of his time helping with implementation support and building gauges as we continue to roll out our Default Dashboards and Reports program. On a side note, Rick may have the most amusing welcome to our team: in an unusually quiet moment in our cozy office, we planned a sneak-attack standing ovation as soon as he hit his chair on the last day of his project role. Poor Rick was startled so bad he was temporarily speechless while we all cheered about the awesome news he would be staying on board full time! Let’s Get Personal Outside of the office, Rick enjoys spending free time with his girlfriend. When their busy schedules allow it, traveling is a favorite hobby - California is a tried and true destination while Japan is # 1 on his wish list. We also know Rick is pretty serious about gaming in his downtime, going to weekly Street Fighter playing sessions in Miami’s Art District. You can also find Rick studying online courses to learn new things - especially in the programming realm as he works to establish himself in a new industry. We’re happy to have Rick as an official BrightGauger, and look forward to seeing him grow with the team!

3 Key Themes We Learned at Schnizzfest 2015

Last week we had the honor of sponsoring the 2015 Schnizzfest Conference hosted by Gary Pica and the team at TruMethods. This is our 2nd time sponsoring a TruMethods event as last year we participated in their fall Winner’s Circle Peer Group Meeting. Schnizzfest did not disappoint this year and both Larry and I really enjoyed spending time with the TruMethods members. It’s safe to say our schnizzing is nearly perfected at this point and as always we walked away with several key themes that we wanted to share: Transparency & Sharing - By far, the majority of our conversations with attendees was around transparency. The common thread? Each leader wants to ensure that every member of their team knows where they stand at all times based on individual performance and to also see at a glance how the entire team is performing. Given that one of our main functions at BrightGauge is our dashboards, which help hold people accountable, we were very excited to learn more about the challenges each service provider experiences and then share ways that data visualization can help solve those challenges. Sales Focused - While most conferences we sponsor focus on operations and service management, Schnizzfest was a refreshing change because most of the people we met were either business owners or team members in sales / business development. I had several folks that wanted to learn more about the Sales Best Practices Webinar we hosted last month and our ongoing Sales Best Practices Blog Series. On a side note, these topics have been so well-received that we’re looking forward to bringing you more content soon in our ongoing Educational Webinar Series. Moving Up The Stack - The industry landscape known in years past to typical Service Providers is changing quickly, and this was a major theme of the conference which Gary brought up several times. Both MSPs and ITSPs are being commoditized and the services they are offering are being pinched on pricing. Gary’s suggestion for providers was to “move up the stack” and become a true business partner to their customers. Those who have adopted this mindset are thriving better than ever. Over the few days of the conference, I spoke with several people who have implemented some very unique ideas to move up the stack and present their business partnership as a valuable necessity rather than an extra support expense. All in all, Larry and I had a great time visiting with the TruMethods community and learning more about their goals and what they are focused on. We’re excited to continue the partnership and we look forward to more schnizzing and finding more ways to get integrated with the community.

Don't Let Your Ticket Categories Get Stale!

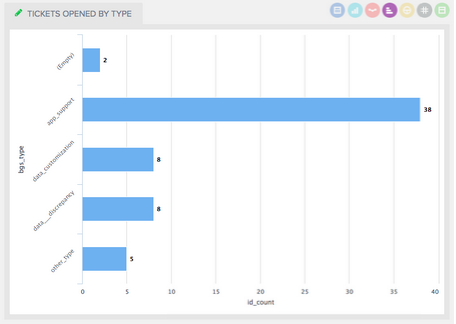
Last week we decided to move the BrightGauge Support function back under the Product Team (under my wild command). We did this for one obvious reason...I want to hear feedback as quickly as possible about the product so we can make quick improvements to fix issues and reduce friction. Thankfully our users are REALLY good at providing feedback and asking questions through support so this should work out really well for everyone. When I took over this function I quickly realized the way we were categorizing tickets (using Ticket Types and Ticket Sub Types) wasn’t providing any actionable insights. We have our support dashboard up on a large TV in our office and when I would walk by I couldn’t get a quick understanding of where we’re having the most issues or friction in the product. By Wednesday morning I changed the type categories into 4 new ones that made the most sense to me and were very simple. They were App Support, Data Customization, Data Discrepancy, and Other. The first two are broad types so that I could segregate tickets between things the dev team needs to investigate (App Support) versus our Implementation and Data team (Data Customization). To be clear, being a business intelligence product for small business, we receive lots of requests to customize our default datasets or expose more data from our customer datasources. Typically those are small billable projects or just one-off easy changes, but to me they are not “product issues” that our developers need to worry about. The two other categories of Other and Data Discrepancy were my attempts to further reduce the noise and find product issues and friction. We receive lots of tickets similar to “My data doesn’t look right” which we call Data Discrepancies and typically these are simple questions or changes needed in the customer datasource. Again, not really product problems but more data specific to that business. I’m not sure this Data Discrepancy Type will stay at a top level as it could be under “App Support” but for now, I’m keeping it as I know I can always iterate on this later. Lastly, the Other category is just a catch all for crazy unrelated tickets. Every once in a while we get a ticket that was meant to be forwarded to some other company, etc. We don’t want to delete these, just categorize them at the top level and filter them out for our reporting. After three days, here’s what our chart looked like on the board: As you can see quickly, a majority of tickets coming in are App Support. That’s perfect and is exactly what I was trying to segment but now we need another level of categorization... SUBTYPES! Before I go on though, take a look at the “Empty” column. There are 2 tickets in there that need to be categorized. One of things I love about using BrightGauge for own internal use is the easy ability to drilldown into that bar and get the ticket numbers. I have this dashboard up on my second monitor throughout the day and I’m able to quickly tell our support team to make sure they are categorizing everything correctly. We have some new support team members so these are great coaching moments that I can catch nearly live. Ok, lets talk subtypes now. Again, based on my own intuition I came up with sub types for the App Support type that I think will provide me the best insight right now. I kept it simple because I know I can always iterate and create new ones...but I also don’t want 100’s of categories... that would be way too much noise. Here’s what those subtypes look like in a pie chart. The Subtypes I started with are Feature Requests, Billing, Syncing, Questions, and Issues. Really, I could have just started with Features, Questions, and Issues but I know from talking with customers and seeing the flow of tickets recently that we’re having a fair amount of questions around Syncing and Billing. So I carved those out as separate subtypes to review separately and figure out our plan of attack. As you can see above, after 3 days there is a decent spread among the 4 categories which means my subtypes are solid! After another week of data flows into these charts, we’ll sit down as a Support and Dev Team together and drill into each of these sections to figure out what other trends (besides billing and syncing) are emerging. For instance, are there constant Feature Requests that are being asked through support? Maybe we tackle those quickly. We’ll be able to quickly tell by drilling down into this pie chart and reviewing the subjects of these tickets (which we rename constantly so its easy to understand the feature from the subject). All of this work to re-categorize our tickets took just a few minutes and will be a work in progress over the coming weeks. The one lesson I learned from all of this is that categorizations can easily get stale and once that happens, the metrics and charts will start to be ignored by you and by the team. I also realized that it’s ok to iterate on these categorizations as things constantly change. Our new support dashboard is working really well internally as I see our team stopping and looking at them every day. Thats what dashboards are supposed to do, they are supposed to change the behavior of the people watching them nearly in real time. Iterating and improving your categorization through new types and subtypes are low hanging fruit to make sure everyone is on the same page with what’s going on in your support organization. It certainly was for us.

4 Pillars of Business Analytics

A few weeks ago I wrote a brief summary of our trip to the Gartner Business Analytics Conference in Vegas and shared the 4 main themes I walked away with from the conference. The Four Pillars of Business Analytics was one of those takeaways and something I’ve been thinking a lot about recently. I wanted to expand more on each one because I think these pillars are going to become more and more important in each organization, regardless of size. Data Business users want access to more and more data. And not just from inside the organization from traditional databases. Business users want to include data sources like social media data and real time geo-location data. Being able to harness all the data available and serving it up to the business user is a critical base component to a solid strategy. People As Business Analytics moves away from a centralized model and towards a decentralized model via a more self service design, the people need to be trained and empowered to know how to use the data. Gwyn Thorn, Lead for Analytics and Visualization Team at Shell told the audience she has 11,000 employees using their Business Analytics solution with 400 additional coming online every month. They spend a lot of time training people to make sure they have the skills they need to use the tools provided. Process Is more for the entire organization and embracing a “fact based” or “data driven” culture. A culture where data intuition is important but not the only factor and users leverage data to make business decisions. Since this is still a relatively new industry there is still a lot of education on “why Business Analytics is important” and how you can increase the business returns because of it. The biggest hurdle is accepting and understanding that information is an asset and a powerful one for any company. Technology Tools need to become more and more open and companies are constantly evaluating how to use best breed of tools to get the results they need. The main point from the technology perspective was to make sure you build a flexible architecture that can be easily adapted. They used the term “agile” repeatedly to express the importance of being flexible. It seems that this pillar is what is driving the higher adoption of cloud vendors because they are easier to deploy and in the event you have to swap them out, they are easy to replace without breaking up the entire stack.

Our Latest Content

// Siteimprove tracking