Don't Let Your Ticket Categories Get Stale!

Last week we decided to move the BrightGauge Support function back under the Product Team (under my wild command). We did this for one obvious reason...I want to hear feedback as quickly as possible about the product so we can make quick improvements to fix issues and reduce friction. Thankfully our users are REALLY good at providing feedback and asking questions through support so this should work out really well for everyone.
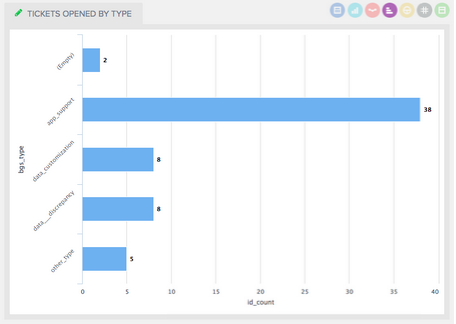
When I took over this function I quickly realized the way we were categorizing tickets (using Ticket Types and Ticket Sub Types) wasn’t providing any actionable insights. We have our support dashboard up on a large TV in our office and when I would walk by I couldn’t get a quick understanding of where we’re having the most issues or friction in the product. By Wednesday morning I changed the type categories into 4 new ones that made the most sense to me and were very simple. They were App Support, Data Customization, Data Discrepancy, and Other.
The first two are broad types so that I could segregate tickets between things the dev team needs to investigate (App Support) versus our Implementation and Data team (Data Customization). To be clear, being a business intelligence product for small business, we receive lots of requests to customize our default datasets or expose more data from our customer datasources. Typically those are small billable projects or just one-off easy changes, but to me they are not “product issues” that our developers need to worry about.
The two other categories of Other and Data Discrepancy were my attempts to further reduce the noise and find product issues and friction. We receive lots of tickets similar to “My data doesn’t look right” which we call Data Discrepancies and typically these are simple questions or changes needed in the customer datasource. Again, not really product problems but more data specific to that business. I’m not sure this Data Discrepancy Type will stay at a top level as it could be under “App Support” but for now, I’m keeping it as I know I can always iterate on this later. Lastly, the Other category is just a catch all for crazy unrelated tickets. Every once in a while we get a ticket that was meant to be forwarded to some other company, etc. We don’t want to delete these, just categorize them at the top level and filter them out for our reporting. After three days, here’s what our chart looked like on the board:
As you can see quickly, a majority of tickets coming in are App Support. That’s perfect and is exactly what I was trying to segment but now we need another level of categorization... SUBTYPES! Before I go on though, take a look at the “Empty” column. There are 2 tickets in there that need to be categorized. One of things I love about using BrightGauge for own internal use is the easy ability to drilldown into that bar and get the ticket numbers. I have this dashboard up on my second monitor throughout the day and I’m able to quickly tell our support team to make sure they are categorizing everything correctly. We have some new support team members so these are great coaching moments that I can catch nearly live.
Ok, lets talk subtypes now. Again, based on my own intuition I came up with sub types for the App Support type that I think will provide me the best insight right now. I kept it simple because I know I can always iterate and create new ones...but I also don’t want 100’s of categories... that would be way too much noise. Here’s what those subtypes look like in a pie chart.
The Subtypes I started with are Feature Requests, Billing, Syncing, Questions, and Issues. Really, I could have just started with Features, Questions, and Issues but I know from talking with customers and seeing the flow of tickets recently that we’re having a fair amount of questions around Syncing and Billing. So I carved those out as separate subtypes to review separately and figure out our plan of attack.
As you can see above, after 3 days there is a decent spread among the 4 categories which means my subtypes are solid!
After another week of data flows into these charts, we’ll sit down as a Support and Dev Team together and drill into each of these sections to figure out what other trends (besides billing and syncing) are emerging. For instance, are there constant Feature Requests that are being asked through support? Maybe we tackle those quickly. We’ll be able to quickly tell by drilling down into this pie chart and reviewing the subjects of these tickets (which we rename constantly so its easy to understand the feature from the subject).
All of this work to re-categorize our tickets took just a few minutes and will be a work in progress over the coming weeks. The one lesson I learned from all of this is that categorizations can easily get stale and once that happens, the metrics and charts will start to be ignored by you and by the team. I also realized that it’s ok to iterate on these categorizations as things constantly change.
Our new support dashboard is working really well internally as I see our team stopping and looking at them every day. Thats what dashboards are supposed to do, they are supposed to change the behavior of the people watching them nearly in real time. Iterating and improving your categorization through new types and subtypes are low hanging fruit to make sure everyone is on the same page with what’s going on in your support organization. It certainly was for us.
Free MSA Template
Whether you’re planning your first managed services agreement, or you’re ready to overhaul your existing version, we've got you covered!


