Note: For the most current plan information, please visit our Pricing page. We pride ourselves in offering our customers plans that are tailored to their needs, but sometimes a little extra ...
Note: For the most current plan information, please visit our Pricing page. We pride ourselves in offering our customers plans that are tailored to their needs, but sometimes a little extra information goes a long way when it’s time to pick the plan that’s best for your business. So, let’s take a closer look at the differences between our Standard, Enterprise (formerly known as Advanced), and Enterprise+ plans as shown on our pricing page: The main differences to note between our Standard and Enterprise plans are in the features offered: Number of datasources included Additional User Licenses Admin/Analyst User Permission Dataset Mashup Calculated Metrics Snapshots Public Gauges + Dashboards Training Sessions Additional Datasources and User Licenses Both Enterprise plans include 1 extra Admin User Account (for a total of 3 Admin Users). An Admin has complete access to the BrightGauge platform to create gauges, dashboards, and reports. Admins can also manage the permissions of Analysts in our Enterprise plans. You are able to add additional admin users as necessary. For pricing, please see the 'Extras' section of our pricing page. The Enterprise+ plan includes 2 extra datasources, allowing you to connect 4 of the tools you're already using. On any of our plans, should you need to connect additional datasources, you can absolutely do so! For pricing, please check out the 'Extras' section on our our pricing page. Admin/Analyst User Permissions In the Enterprise plans, you have the ability to limit users by creating them as Analyst users. Analyst users are limited by the datasets the Admins give them access to. For example, in the image below you’ll see 3 different types of access for datasource: ConnectWise PSA (formerly ConnectWise Manage) - The Analyst has full access to the data (all datasets selected) QuickBooks - The Analyst has partial access (only some datasets selected) SmileBack - The Analyst has no access (no datasets selected) Dataset Mashups This is an often overlooked but very powerful feature. Standard plans can create layers using the same dataset (using different filters on each layer), but Enterprise accounts can create layers from different datasets and even different datasources. Layers are a great way to look at different groups of data, so the ability to see data from different datasets and different datasources provides more context into your data. Want to look at tickets resolved and time entered by technician? That’s a dataset mashup. Want to compare tickets opened to machines monitored? Again, a dataset mashup. Calculated Metrics Our Calculated Metrics feature allows you to create simple, yet powerful calculations using the common arithmetic operators like addition (+), subtraction (-), multiplication (x) and division (/). Here are a few of our most popular examples: 1st Touch Resolution - Number of Tickets Resolved in First Touch (Layer 1) divided by Total Number of Tickets (Layer) Kill Rate - Number of Tickets Open (Layer 1) divided Number of Tickets Closed (Layer 2) Service Gross Margin - first calculate Service Gross Profit (Total Services Revenue minus Total Services COGS) then divide that by Total Services Revenue. Snapshots Our Snapshots feature will allows you to create historical trends on the data you care about most. It's a way to store the data that your PSA or other tool won't. For example, you can set your Snapshot gauge to capture your end-of-day-ticket count, plot it onto a chart on a daily basis, and show you your ticket trends over time. Public Gauges and Dashboards You can now share your data publicly, such as on your marketing site or in client portals. Perhaps you'd like to show your prospects your average CSAT score, or maybe you'd like to emphasize your average ticket response time. These KPIs can now be made public on the site of your choice. Training Sessions Talk to any of our partners and they will assure you that our support is unmatched. We really care about helping you solve your problems quickly and personally, regardless of whatever plan you've chosen. Every one of our partners will receive support and guidance during their onboarding period. However, those on our Enterprise+ plan will have access to additional one-on-one training sessions. Plus, our Enterprise+ plan includes one pass to a Data Driven Workshop, where you'll get advanced training and be able to network with other partners to share best practices and strategies. As you’re considering the standard or enterprise plans, make sure you weigh out the features that are most important to you. For example, if you have a team that will share management responsibilities within the platform or you want to display PSA and RMM data simultaneously in the same gauge, our Enterprise plans will be your best match. On the other hand, if you’re the sole person in charge of managing data or only have one source to wrangle, our Standard plan will be the business intelligence boost you need. Don’t forget, we are continually adding new features to our plans so please make sure to stay tuned for additional announcements or visit our pricing page for the latest info.

What do you think of when you hear the word ‘job’? Probably a situation where you perform a specific task and earn a paycheck for it, right? There’s a different definition for ‘job’ and it can radically transform your business approach, making you more laser-focused and maybe more successful. It has to do with what life benefit your customer is looking to gain from using your service. More on this ahead. What about ‘marketing strategy’? What does that involve? Do you typically create a strategy based on target demographics? A buyer’s persona? As direct competition to a similar service that’s already being packaged by someone else? Do you focus on the service attributes itself? If you’re nodding your head, you’re not alone. Traditionally, we’ve been taught to look at marketing from this perspective. A lot of companies get their start by looking at an existing product or service and deciding “oh, we can do that better”. But what if we’ve been taught wrong? Another perspective exists and there’s a strong argument out there for changing your strategy. A different approach to marketing We’re talking about wholly shifting your focus to the customer’s emotions. What is the user’s situation? How can your service help them make progress in their lives? What job does the customer actually need your product or service to do for them? The argument is the theory of Jobs to Be Done (‘job’ meaning the progress a person is looking to make). It is not a new theory. It’s been documented in many books like a favorite of ours, Competing Against Luck, by Clayton M. Christensen. It has been applied by successful companies like Uber, Unilever, and Deseret News. Yet, many people are still confused by or unaware of it. To help put this theory into perspective, check out the commonly cited ‘milkshake theory’: At BrightGauge, we like this simplistic approach. While a little difficult to put into practice, we’ve found it helpful to look into how other companies are answering to the jobs their customers are hiring their services to do for them. Start by talking If you’re in the process of identifying the needs of your own customers, you may be asking where should I start? The answer is so obvious that it almost feels wrong. The best place to start is to talk to current customers. Ask brand new users what prompted them to make the switch from another service to yours. Don’t neglect recently churned customers - ask what caused them to leave. More likely than not, you’ll discover some incredibly helpful insights. You may even find your product or service is being used in different ways than you intended, which is not a bad thing! Quick example: Uber may have been started to help passengers have a great experience while getting from point A to point B, but the founders probably didn’t think some would use it as an alternative to owning a car. When talking to your users, it’s pretty important to get down to small, seemingly insignificant details. If you ask John why he hired an Airbnb rental over a hotel room and he answers, “it was a good price”, you can’t stop there. The fair cost is not the reason John is making progress in his life. What emotional value does Airbnb bring to John? With a little probing, you’d be able to discover that his true underlying need was to feel like he was actually living in the city he was visiting. He wanted to feel at home and Airbnb could do that job better than any hotel room. Before talking to customers, it might help to understand the typical timeline in a buyer’s decision process: Consider the ‘consideration set’ While you’re talking to customers, think about the emotional value your product or service brings. Keep the ‘consideration set’ in mind as you formulate new ideas for improving your service. That is, the other products that compete with your product. In John’s example, you might be tempted to think that all other Airbnbs or hotels in the market are the only existing competitors. Not true. Remember what he hired Airbnb to do (feel at home in a foreign city). Instead of an Airbnb, John could have hired a friend’s couch, leased an apartment, or done nothing at all. Conversely, he could fire his current home and move to the new city (kinda drastic, but not impossible). Don’t fall into the trap of believing you’ve got a service with zero competitors. You have to ask yourself if it’s really such a good thing to be on your own in the market. Is that an indication that your product is not a right fit? A little healthy competition is a good sign of future growth opportunities. It can be easy to think of products and services that are similar to your own, but it takes more effort to identify the less obvious competitors. However, this effort can lead to big rewards. The 5-Hour Energy Story Manoj Bhargava was perusing the energy drinks available at a tradeshow he was attending, in hopes of finding a pick-me-up. He realized the products on the shelf were too big - he wasn’t thirsty enough to consume a large energy drink. Also, he also didn’t want the extra sugar and junk commonly found in those drinks. He dreamt of a healthier and much smaller energy booster. When thinking about where in the supermarket to place it, he didn’t think it made sense to place it next to sodas, or water bottles, or other large drinks because customers needed a boost, not a thirst quencher. Instead, Manoj thought of the check-out area. Customers needed something convenient, quick, and that would help them have a productive day. Out of those needs, 5-Hour Energy was created. Chock full of vitamins and less than 3 ounces, it’s an effective grab-and-go solution. So effective Manoj is now a billionaire. Had Manoj thought to place 5-Hour Energy alongside Gatorade (an obvious competitor), the story may have turned out differently. Putting on a BrightGauge lens We are constantly exploring new ways to help our customers improve their lives through the use of BrightGauge. Through trial and error, plus a lot of talking to customers, we’ve come to understand that we’re here to help them easily see all their KPIs, impress their clients, and motivate their team. This all makes a really big difference to a lot of people’s businesses. Our work isn’t done though. Figuring out your product/service and the emotional value it delivers to people is just one piece of the puzzle. How do we apply this same frame of thought to other areas of business, like marketing? Base your communication on emotions, not features Every marketing strategy involves a lead generation campaign of some sort. If you’re not generating leads, you’re not gaining customers. No customers means no business. In today’s age of digital marketing, there are many tactics to choose from, ranging from pay-per-click (PPC) to retargeting campaigns to personalized emails. The method you choose is not as important as the message you put out there. So many times, you see ads that try to lure leads in by screaming “FREE Trial!” or “Lose 10 Pounds in 1 Day” (a.k.a., a totally unrealistic promise). Your customers are smarter than that. They will recognize click bait when they see it. With all the screens in their lives flooded with messages like that, how do you expect to stand out? Instead of focusing on shiny-gimmicky features, talk to customers about how your service will help them. Bring their emotions into the picture, because that’s what they will connect with. We like what Snickers has done. They’re not marketing themselves as “the best chocolate ever”. That’s just an unsubstantiated and very subjective claim. Their slogan is, “Hungry? Why Wait?”. First of all, everyone can relate to being hungry hangry. It makes you tired, cranky, moody, whatever. So, instantly a connection has been made. Secondly, they’re alluding that a Snickers can replace a meal. They’re helping their customers by keeping them full enough to get on with their activities and to last until dinnertime. Suddenly, Snickers is competing with a sandwich, and they become the best-selling candybar on the market. Genius. How we provide value through facetime We mentioned three key ways that BrightGauge helps customers make improvements on a daily basis. Working off of those insights, we realized that not every new customer is seeking the same solution. So, how do we communicate in a way that’s resourceful and truly valuable? We ask questions and we do it in person. BrightGauge is simple to use, but our users’ needs can get complicated. We like to take a hands-on approach to helping them find solutions. Through Data Driven Workshops or Customer Site visits, we ask our customers what they are looking for. Based on their answers, we tailor our demonstrations to provide the most value to each individual. For example, if a customer mentions that they are looking for a way to show their worth to their clients, we know we can help them gain more business through our reporting tool, which is a powerful way to build trust and credibility with clients. It’s more efficient for them because they’re getting comprehensive and valuable answers and they’re able to dive deep into our product. It’s helpful for us because face-to-face time goes a long way in building lasting relationships with quality customers. Plus, it’s fun for us! Take a new approach to your business plan If you’re trying to think of the next “big idea” or if you’re finding ways to strike gold, dial it back a bit. Take time to ask yourself “how can I make people’s lives better?” instead of “how can I create a super cool service?”. See where you can inject an extra bit of positivity into someone’s day, and hopefully, make them feel like a superhero for their team. It’s not really about reinventing the wheel here. It’s truly about making a positive difference in people’s daily lives. Consider the pain points that would drive someone to hire your service and fire the one they had already been using. Put yourself in the customer’s shoes and imagine the life events that cause you to take action in your own job. Remember: Job doesn’t always mean employment. It can mean progress being made in one’s life Consider a customer’s emotional, functional, and social situation - context and circumstance matter Your existing competitors may be in an entirely different product category Always use a lens of “how can I help my customer?” and not “look, what I offer is so pretty!” There’s a whole lot to learn about the Jobs to Be Done (JTBD) theory and, if anything, it’s an interesting lens with which to view marketing. We’ve found this site and this site to be helpful resources in learning more about this theory, but our ears are always open! How have you applied JTBD to your world?

Upon stepping into the BrightGauge offices you’ll find just about every wall has a flat-screen TV hanging on it. Given the nature of our business, it makes sense that dashboards are our favorite decorative choice. As an added bonus, it makes keeping up with March Madness, The Olympics, The World Cup, The World Series (you get the drift) way easier. The TVs throughout our office display different dashboards with important internal operations metrics like support tickets, financial data, and customer sign ups. These dashboards also serve as a test model for any upcoming releases we may have. A few years ago, when we first started using these TVs for dashboard displays, we ran into a common issue: too many dashboards, not enough TVs. Thus, rotating dashboards were born. Dashboards Make You Look Good We first fell in love with dashboards for many reasons. High up on that list is they take all of our super-important KPIs and put them in one place. That place happens to be front-and-center, highly visible, and packaged into an aesthetically pleasing dashboard that keeps us informed and our operations efficient. Another reason we love dashboards? They make us look really freakin’ good, and smart. When you’re in the service industry and you’re trying to win and keep your client’s business, it’s essential to prove your worth to them. You want to show that you’re working hard to make good on your Service Level Agreements and that you’re proactively monitoring the service desk so that nothing falls through the cracks. Undoubtedly, that’s what dashboards help you do. But when you display those dashboards on TVs around your office, you kick things up a notch. Suddenly, clients come in for an office visit and are blown away by the operation you run. They see important metrics displayed out in the open and they begin to trust in you a bit more, seeing that you’re serious about making sure your clients’ well-being is always kept in sight. Boom! That’s how you get ahead in business. What’s Rotation Got To Do With It? You have lots of clients to manage. And you have lots of data to view. Sure, you could build a wall made of 12 TVs and display one dashboard on each. But that’s kind of intense and not at all practical. You could also overload one dashboard with tons of gauges. Again, not very practical. If you find yourself with limited screen space (whether it’s screen size or count of screens in an office), using our rotating dashboards feature will let you view all of the important metrics you want to see. How Many Dashboards Can I Actually See? Great question! To get started with rotating dashboards, click on the TV button found in the top right corner of your dashboard screen. Your drop-down should show two options: Single Dashboards and Rotate Dashboards (<-- select this one). Then, you’ll be prompted to select a playlist. You can have three playlists and each one can have a max of 10 dashboards. And don’t worry about anyone messing with your playlists - each one is private to your user account, so customize away! Once you’ve set your playlist, you’re good to go. By default, each dashboard rotates every two minutes, but you can change that. We have four options (30 seconds, 1 minute, 2 minutes, 5 minutes) available once you’re in present mode. Get Your Rotation Going You work really, really hard to earn your client’s business and trust. Without that, you have no chance of growing your own business and celebrating your own success. So why not simplify things a bit? Make yourself look as smart and productive as you are. Dashboards - especially rotating ones...especially displayed on beautiful TV screens - make one heck of an impression. There’s a lot of value in that. Want our top 5 rules for designing killer dashboards? Download our Dashboard Best Practices webinar here or by clicking below. Editor's note: Original post was published in June 2014 and has been updated for accuracy.

In any relationship, trust is not something that’s blindly given. The same can especially be said for client-agency relationships. Trust is something to be earned, nurtured, and strengthened over time, and it requires work from all parties involved. One way to foster a trustworthy relationship is to practice transparency. When you take assumptions out of an equation, you make room for credibility. Over time, it’s easier to “take your word for it” because you’ve proven yourself by being consistantly transparent, and so trust in you becomes second nature. It’s a beautiful circle. We’ve found that sending regular, consistent Client Reports is a powerful way to stay transparent. What does transparency really mean? Transparency shows that you’re doing what you say you’re going to do. As MSPs, you usually begin a relationship by establishing a Service-Level Agreement, or an SLA. There are services you need to deliver on and it’s not enough to say, “don’t worry, we never miss a deadline”. Your clients don’t know that. Beyond making a guarantee, expectations need to be properly set. It’s likely you have regular calls, meetings, and other forms of check-ins to let your clients know what you’ve been up to and how you’re tracking against your SLAs. These check-ins need to be well-rounded by including both the good and the bad since your last meeting. We’re only human and mistakes happen. If you’re not being truthful about issues that have popped up or errors that were made, then you’re missing the whole point of being transparent. Be direct, be honest, be an open book. Reports are all about this You never want to get to a point where clients are asking you, “why are we paying you?”. Client Reports are a great way to avoid that. Since they are based on hard data and facts, reports eliminate any presumption of “smoke and mirrors”. What you see is the true picture. If you show your clients that you’re consistently meeting or exceeding SLAs, they’re more likely to pay you better and see your value for the long-term. They’ll be more satisfied, you’ll experience less churn, and everyone will be happier. By the way, clients are not the only ones who benefit from reports. Your team members and higher-ups can also benefit from a quick status update. Sending internal reports is an awesome way to keep your team on the same page, accountable, and productive. How often should I send reports? As a best practice, you should be sharing reports with your clients at least once a month. But we’re in the habit of thinking more is more (when it comes to this). A weekly or a daily report, especially in the beginning of a relationship, can ease some of the anxieties that come with putting your business in the hands of others. The nature of our business is fast-paced. Everyone relies on technology to get them through the day. If servers are down or patches are not up-to-date, that probably means that work is being disrupted in a big way. As MSPs, you’re constantly trying to avoid those situations by preemptively responding to issues before they grow. You need to be highly proactive and reactive every day. So reporting on your daily tasks makes sense. What should I include in reports? Start with your SLAs and KPIs and work backwards. What are your clients most interested in? Decreasing ticket response time? Great, put that at the very top of your report. Do they want to know how many hours were billed per technician per day? Make sure to include that, too. It varies from client to client, so make sure you’re listening to their needs. Reports make you look good by showing your value and your worth (how you’re helping them avoid a meltdown!), but only if it relates to what your client cares about. You can be direct here. Clients won’t look down on you for asking what exactly they’d like to see in their (daily, weekly, monthly) reports. Instead, they’ll appreciate that you’re being proactive. When possible, add context to your data. Include a brief introduction that explains the good and the bad or try adding a few text boxes that make it easier to interpret charts. Make sure you’re offering up solutions to any problems that you’re pointing out. Who should I send reports to? The obvious answer is your point of contact. But don’t stop there. If your point of contact ever leaves, you don’t want to be out the door with them, right? Make sure more than one person really understands how valuable you are. Consider sending reports to your point of contact’s boss and the business owner, too. Pro tip: send your reports early in the morning so clients can see it as soon as they start their day. How do I generate reports? Ah, here’s where it gets real simple. Have your software do it for you. With BrightGauge, we recommend automating these so that you can send reports to many customers at a time on an ongoing basis. BrightGauge reports go a long way If you’re only using your BrightGauge for gauges and dashboards, you’re missing out. The wonderful thing about having all your PSA, RMM, and other tools in one place is that you can create beautiful, comprehensive reports out of all that data. And it’s literally as easy as 1, 2, 3. Whether you’re sending an internal or a client report, you have two options: choose from our pre-built templates or create your own custom report. They’re both so easy to use. Populate your reports with the agreed-upon important data, select your clients, choose to automate your report (i.e., tell BrightGauge to send this report every Wednesday), and you’re good to go! Bonus BrightGauge benefits: Personalize your reports by including your company’s logo. Involve your clients with interactive report. They will be able to click into data and drilldown further for more details. Insert page breaks so that your report is easy to digest and easy on the eyes. Apply filters to your reports so your client sees only the most relevant information. Trust, credibility, churn, growth, long-term relationships - these are all of utmost importance to MSPs. Reports increase transparency and that brings trust along for the ride. What will underutilizing reports do for your business? We don’t recommend waiting around to find out. Want to learn more about how to create the best possible reports for your clients? Download our Client Reporting Best Practices webinar here or by clicking below.

Everyday, we come face to face with acronyms that are used for a variety of reasons. Whether we’re texting “LOL” to a friend who just sent us a funny gif or we’re asking a colleague to send us a report by COB, acronyms are woven into our daily conversations. Every business and industry has their fair share of acronyms and the MSP world is no different. Today, let’s explore those acronyms most relevant to MSPs and why we should care about them. Why acronyms? Acronyms exist to make things simpler, right? The problem is, sometimes it feels like there are just TOO many acronyms to make sense of! Why the heck are there so many?! There are a ton of terms that go hand-in-hand with describing technological systems, differentiating datasources from one another, and knowing which software can satisfy your different business needs. So, you can understand how using acronyms over multi-word terms has come to be common practice in just about every industry. Less time is spent getting the words out, while more focus is placed on what’s most important: getting stuff done! Yes, it takes everyone a little time to get used to speaking in this new language, just know that you’re not alone! While the list of acronyms we use can be seemingly endless, there are some that you’ll probably come in contact with more than others. Top 9 acronyms to know These are the ones you'll come across most often. Keep this cheat sheet handy: KPI - Key Performance Indicator; if you’re a business owner or team lead (or, really, if you just work in a company), this one is very important for you to know. KPIs are performance measurements that show a company if they’re meeting their goals. They effectively give you a picture of the financial and overall health of your organization, which you really need to know if you want to be successful. Determining how to set KPIs can be tricky, but it is such a critical task. MRR - Monthly Recurring Revenue; this is all of your recurring revenue normalized into a monthly amount, so it’s a way that you can track sales and trends over time. MRR is calculated by taking your number of customers and multiplying that by the average of what they are paying you (MRR = customers * average billed amount). More than likely, one of your KPIs will be tied to your MRR. When setting goals and tracking MRR, it’s important to account for churn, which is a normal aspect of business operations. SLA - Service Level Agreement; this is the contract between an MSP and their customer (an SMB) which will set expectations for the relationship. In the SLA, the MSP will define the services that will be provided, and the metrics that will be used to analyze the quality of those services. Sometimes, an MSP will offer services in different tiers (basically, if you want more services, you’ve got to dish out more moola). PSA - Professional Services Automation; this is literally software that assists professionals. PSAs are the king of making life simpler, especially for project managers, as they work by automating every day tasks. PSA software, like ConnectWise Manage, Kaseya, and Tigerpaw, can help you do anything from managing timesheets and expenses to customer relationship management. RMM - Remote Monitoring and Management; this is a type of software that MSPs use to manage their SMB’s IT systems. Most MSPs service multiple clients, so it would be impossible (and mega expensive) for them to be on-site at all times. With the use of RMM software like ConnectWise Automate, Addigy, or Autotask, MSPs are able to keep tabs on the systems to make sure they are functioning as they should and can fix problems from a remote location. This is a win-win for both the MSP and the SMB, as it reduces the time it takes to get something resolved (i.e, no time wasted driving to and from the client’s office). NOC - Network Operations Center; a centralized location where an IT team can support RMM software efforts. Basically, it’s a watch center where activity is monitored to avoid any disruption in operations. For example, if a client’s server goes down, a NOC technician can submit a ticket identifying the problem, which the MSP can then work to resolve. SQL - Structured Query Language; often pronounced ‘sequel’, this is basically a language that allows you to ask databases different questions (aka queries) in the same way, no matter which database you are using. It’s kinda confusing, but think of it as a way to talk to your data and get it to talk back to you (common SQL statements include SELECT, INSERT, UPDATE, DELETE, CREATE, and DROP). This article helps break it down a bit and this site even teaches you SQL. BIaaS - Business Intelligence as a Service; BIaaS takes the data gathered from SaaS and analyzes and interprets it into information that can be useful for making business decisions. For example, let’s say an SMB wants to know how many issues or tickets it is encountering on a daily basis. The MSP who is managing all of their SMB’s SaaS apps will use a BIaaS tool to determine how many tickets are being entered every day, how quickly those tickets are being resolved, and how efficiently the SMB’s devices are running. Through that data, the SMB may realize it needs to restructure or reorganize its employees in order to see better business outcomes (see how BrightGauge could be the right BIaaS tool for you). API - Application Program Interface; a set of tools for building software applications. APIs are like the bricks you need to build a house. Programmers are the ones who take those bricks and put them together. A really simple example to understanding what an API does is when you copy text from Microsoft Word and paste it into PowerPoint. The API is what allows that to happen. Just like SQL is code that allows you to talk to your data, API is code that allows software programs to talk to each other. What’s the point? All of these software languages, metrics, systems, and services work together under the surface for one common reason: to help businesses be more informed and run smoothly. You have a lot on your plate each day and these systems are in place to make your decisions a bit easier. It’s a complicated, convoluted process with a clear end result. Putting acronyms (and data) to work Getting to the information is just one step in making data work for you. An MSP who analyzes data from several different PSAs and RMMs in order to help his clients reach their KPIs has his work cut out for him. But if there were a way to take those time consuming tasks out of the equation yet have a more efficient business, wouldn’t that be ideal? Just like acronyms make talking about technology simpler, BrightGauge works to make your data a lot more accessible. By interpreting your data in a dashboard that updates in real-time and providing you with a support team who has your back, you can focus on the important decisions that will make your business more successful. TL;DR: acronyms make words simpler. Data makes work simpler. Knowledge is power, so unlock the power of data and start making simpler and more effective business decisions today.

70+ Metrics for MSPs
Key metrics and accompanying formulas to help MSPs skyrocket growth and success!
Get your KPIs

There’s a lot to BrightGauge. While some customers may request more features, most are looking for more shortcuts; a simpler experience. With that in mind, this week we’re focusing on an oft-underutilized time saver: Dashboard Filters. As a fairly new user myself, I’m constantly discovering new capabilities within our app. When I was familiarizing myself with how everything worked, I found myself returning to the question of when was best to use a Dashboard filter versus creating a new gauge. Dashboard Filters These come in handy when you're looking to modify multiple gauges across your dashboard to see previous trends or get client specific. Dashboard filters are applied when you want to quickly toggle to another date range or view stats for a specific team member or client without having to build a specific gauge for them. Most used Dashboard Filters Filter by agent OR client -- This is used when you want to view a set of gauges with an individual client or team member in mind. Instead of making a specific dashboard for each employee or customer, use this is as a shortcut to view a team member's support stats or how many resources a client is pulling from your company. Toggling between date ranges -- Compare project and ticket statistics like kill rate, churn rate, and anything else you'd like to compare across this month, last month, and with some datasets, within the last 120 days. How to set up Dashboard Filters To apply a filter to a dashboard, you can either update an existing dashboard or clone a dashboard. When you create a dashboard filter, it's specific to that individual dashboard(unless you choose to clone one with existing filters in place). Most filters are created for sharing one dashboard with multiple clients. If you're monitoring the same gauges for multiple clients, then this is a must for you! To do this, clone the dashboard you'd like to share, then apply a filter to make the gauges shown specific to that client. Rename the dashboard, and you're ready to give that customer Viewer access to that dashboard. When adding a filter you're prompted to select which fields you'd like to apply it to. *Note that any field selected, its corresponding dataset will also have the filter applied ie. all gauges associated with that dataset on that dashboard will also have the filter applied to them. If you want to only apply a filter to one or two gauges, and they're linked to a dataset that's tied to even more gauges within that dashboard, then create a new gauge or modify an existing one. Tip: looking for an easy way to tell if your dashboard filters are on? Just look for the green triangle in the upper-right-hand-corner of each gauge! Gauge Building So you've found that while your dashboard filter is helpful, it covers a little too much. As mentioned in the previous section, once you apply a filter to one gauge, any other gauge there belonging to the same dataset will also be filtered. For this instance, it's best to create or modify an existing gauge. It's important to note modifying an existing gauge leads it to appear differently across any report, dashboard, or goal list where it's in use. First check the Usage panel in the gauge builder to see which dashboards and reports are already using it. Your best bet is to just copy the gauge, change its name, and then update your filters from there. Saving it as a new one will avoid overriding one of the defaults or existing gauges that may be in use by another teammate. Using a Dashboard Filter with a Gauge that's Filtered It's a BrightGauge tongue twister! Really, I don't want you to miss all of the cool details that have gone into making your BrightGauge so customizable. The main tip here is even with a gauge filter in place, any dashboard filter applied will override any gauge filters. If you'd like to learn more about best practices in setting up your dashboards, reach out to our Customer Success team. Featured image credit: Tony Babel

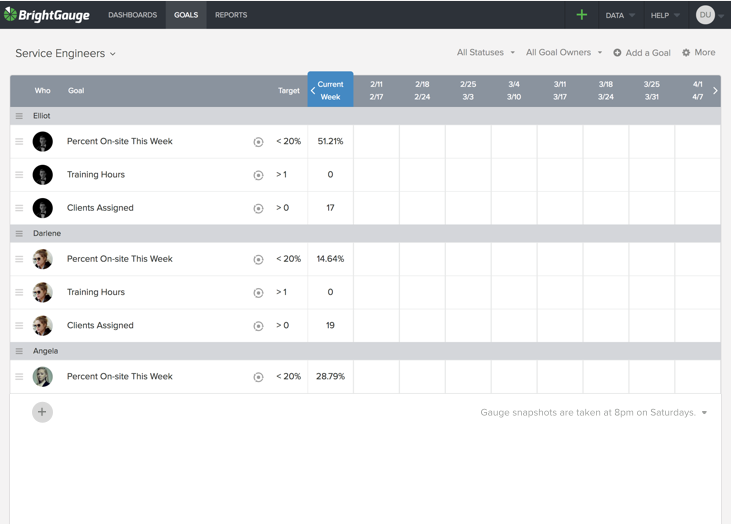
When you're setting business goals, whether it is an individual goal or a team-based goal, it is important for every goal to have an owner. This person is ultimately responsible for monitoring goal progress and delivering positive outcomes. A lack of goal ownership can quickly lead to problems, particularly within teams. Without someone there to organize and manage the completion of the goal, it’s easy for team members to start pointing fingers. Ultimately, this disarray harms your chances of a successful outcome. Aside from this, there are a few important reasons why every goal you create should have an owner assigned to it. Create Accountability & Facilitate Motivation When you assign a goal to a team as a whole, the ultimate success or failure to achieve the goal lies with the entire team. Assigning an owner doesn’t remove the rest of the team from that accountability, but it does place accountability squarely on the owner’s shoulders. This ensures that at least one person within the group stays focused on the goal, even while working on other tasks. It gives them extra motivation to focus on the goal and stay on top of it during long-term projects. Make Delegation Simple When you assign a goal to a team without a leader, it’s easy to see delegation become an issue. A quick conversation about who will handle which tasks can quickly devolve into an argument that can endanger the success of the project and harm cohesion in other areas of the business. Having a goal owner to delegate and manage not only ensures they have clear authority in goal-related discussions, it also gives your team a higher chance of a positive outcome. During any long-term project, disagreements are almost certain to arise. Having a goal owner in place will keep things on track. Give the Goal Owner the Opportunity to Step Up Attaching a goal to a specific owner can be a great way to gauge their readiness for leadership. In fact, most teams will have multiple goals, resulting in multiple sub-teams working on different long-term projects. Each of those projects will require their own individual owners to oversee the team. Are they able to delegate tasks and monitor progress? Can they motivate their team? Were they successful? Looking at their leadership along the way can say more about the viability of the goal owner to take on more down the road. Missing the mark on goals can happen though. How they deal with it is the key to their long-term success. Goal Ownership is Critical to Successful Outcomes Leadership is important at all levels of an organization. A company needs a CEO and leadership team to set the agenda and course-correct when required. Departments need leaders to delegate tasks and oversee the bigger picture. Start assigning ownership to goals and the leaders will rise to the top. To learn more about how to get started, download the full whitepaper on setting business goals here.
It’s easy to declare goals for yourself: make more money, improve team chemistry, or become a thought leader. We can all make declarations. However, it’s hard to tell which goals are actually the right ones to tackle. Outside of your immediate desire to get better at something, there are many things that take up your focus and time to improve. Most goals fall under the mentality of “I have always wanted to [insert goal].” Unfortunately, it never quite works the way you plan. You start out with a clear focus and then get distracted. Convert gauges into goals The beautiful thing about data is you don’t have to make these decisions alone. The data speaks for itself. It’s up to you then to decide which areas to focus on first to move the needle. Luckily, your Brightgauge dashboards and reports are a great starting point for helping to determine where to go next. No need to try to measure something new, work with what’s already in front of you. With Brightgauge, you’ve got a finger on the pulse of your everyday business activities. Which consultant is out at different jobsites today? How much MRR should be making it through the door? Which support team member is taking on the highest volume of tickets? These are just a few of the many metrics you follow to determine how much your business is thriving. So while you may be tempted to try something new, the best place to start is by setting goals based on the KPIs you’re already tracking. Just review your most active internal dashboards and start creating goals from gauges. How to set them up To convert a gauge, go to your Brightgauge goals management section and choose between a Process or an Outcome goal. An Outcome goal is something you’re working towards achieving over time, rather than just tracking when something is complete a weekly basis. Whereas a Process goal covers the steps or actions you must take to help you attain a larger outcome goal. You can always use our Goal Inspriation tool too. The goals shown there are common choices other MSPs tend to track as well. Some examples include: project hours, cash in bank, and bring down resolutions times. Pick a goal and set a threshold you want to meet over that period of time. Since you already have a specific gauge in mind, you can draft your goal from scratch. Select whether you want to track an outcome or progress goal. Type the name of the gauge you wish to track into the first step for creating that goal. Set a target goal number to work towards. Assign the goal to yourself or another team member. Add a description with a clear objective. *Keep in mind that goals can only be based off of number or progress gauges. KPIs to Track First Want more account upgrades? Have your Sales (or even your Success team) examine previous account upgrade and downgrade trends, then set a realistic goal for the quarter to hit that mark. Even if you find yourself getting off track along the way, you’ll see the trend and be able to adjust. One of our favorite gauges to track is our Kill Rate. This combines the measurement for number of open support tickets versus number of closed tickets in a given time period. With this one number, you’re able to see where your service backlog stands and understand what may be stopping more tickets from being answered — aside from always needing more hands on deck! As fans of transparency, we like to eat our own dog food. We use goals to make sure we’re keeping on track each and every week. There’s no need to make a goal up. Your time is limited and BrightGauge helps you get those lost hours back. For more help, reach out to our data experts to turn your KPIs and gauges into actionable goals.

You’ve done it! Months of blood, sweat, and tears — well, hopefully not actual blood — have paid off and you’ve reached the goal you set for yourself. Maybe you thought the goal might have been impossible when you originally set it, but here you are proving yourself wrong. It’s a great feeling. You feel a weight lifted off of your shoulders. When you complete a goal, it’s no longer a goal but an achievement. Something to be proud of. Something to celebrate. Determined people are the ones that complete their goals though, and losing that sense of direction can be jarring. That goal has been burning a hole in your heart and mind for months. You’ve spent so much energy reaching this goal, that being left without it may leave you feeling empty. So, what do you do now? Where do you start? You’ll need to find something to fill that void. Take a More than a Moment to Celebrate Don’t dive headfirst into your next set of goals until you’ve had a chance to appreciate the hard work you put into your previous goals. Whether you reached your goal early and are celebrating alone, or have reached the end of the goal period and are celebrating with the team, allow yourself some time to kick back and have fun. Even the best work environments create a certain amount of stress. Setting goals that require a lot of hard work always come with some amount of stress. They’re designed that way. By setting your bar for success high, you’ve added onto the normal, but hopefully small, levels of stress that come with your current position. So, take some time to enjoy having nothing on your plate. For the first time in a long time, you aren’t chasing a nearly impossible task. Hit happy hour after work. Hang out with your colleagues and discuss everything but work. Go home to your family and enjoy the weekend. Soon, you’ll have a new goal on your plate and the old feelings of stress and doubt will come flooding back. A new round of goal-chasing will start. There is no point in setting goals if you can’t enjoy your own success too. Help Others Reach Their Own Goals If you finish your goals ahead of schedule, use the time to start brainstorming future goals and focusing on your optimizing your daily routine. With the extra time you would have spent pushing extra hard toward that goal, you can help others to achieve their own. While it’s important to make sure you don’t do their work for them, there is nothing wrong with finding ways to help. Perhaps you can take over some of their busy-work to give them some extra time to focus on reaching their goal. You could help them brainstorm ways to improve their workflows and be more efficient. What’s most likely— you'll serve as their shoulder to cry on. Find ways to become involved. Providing a little bit of encouragement can go a long ways toward helping your team. Be a positive influence and you’ll have more people to celebrate with! Refocus & Prepare for the Next Round Once you’ve got the celebrating out of your system and have had some time to refocus, prepare for the next round of goal-chasing. Even if you set your goals collaboratively as a group, start brainstorming new goals or ways to improve upon old goals for your next round. Consider your previous goal. What about it worked? What could have been improved on? Consider these questions both for your goal setting process and the workflows you followed to complete the goal. Chances are that over time, you’ve improved the work processes you used to help you reach the goal. Will that affect how high you set the bar for the next goal? Mindset plays a big role in your ability to complete your goals. If you're burned out, you’ll have a hard time getting back into the groove of chasing a new goal. Make sure you give yourself a break to tackle the next goal with the same vigor and motivation. Once you're settled, dive in. Setting New Goals After successfully completing a goal, there are a few strategies you can take when setting your next one. Like the first, you want to make sure you follow the SMART goal system to ensure what you’re working towards is worthwhile. The SMART goal system dictates that all goals be: Specific Measurable Achievable Relevant Time-Bound These should apply to organizational, team, and personal goals. With those principles in mind, there are a few strategies you can take for setting new goals. Move the Goalpost for Success There were good reasons behind the last set of goals you chose. In all likelihood, they deal with important aspects of your job. Since all goals should be tied to specific KPIs, there is a good chance future goals will use those same metrics. However, the fact you completed the last goal successfully means that you should set the bar a bit higher. Consider moving the the goal post for success a bit and using your last goal as the foundation for a new one. If your goal had been to secure $10,000 in new monthly recurring revenue, try upping that number to $15,000. Consider how long it took you to complete, and with a better idea of how to achieve success, what you will be capable of this time around. Expand Your Previous Goal You can also use your previous goal as a foundation for a new goal while expanding its scope. For instance, if your previous goal was to secure $10,000 in new monthly recurring revenue, you could add new components to your goal to make it more challenging the second time around. For your new goal, you could choose to secure $10,000 in monthly recurring revenue while also securing $10,000 in one-time project-based sales. Any additions you make to your goal should follow the SMART goal principles, and play a critical role in your job duties. Appending a new metric to your old goal adds a new dimension and makes it more challenging. Just because you reach a goal doesn’t mean you need to completely move away from it in future goals. Build upon old goals by expanding their scope. Set a Completely Original Goal Sometimes in pursuit of your goal, you may realize you took the wrong approach. Maybe you should have set the bar lower to make it more achievable. Maybe you should have used a different metric that would have been a better measurement of success. Regardless of whether or not you achieve your original goal, sometimes it is best to start fresh, especially after having months to figure out ways to improve your goal-setting. For instance, you may find that attaching a dollar value to a goal may make it so that aspects of achieving your goal are out of your control. Sometimes luck just isn’t on your side. In example, instead of setting a goal to secure $10,000 in monthly recurring revenue, instead you could decide to set a goal to secure one new sales call per day. Both metrics are ultimately building toward the same end goal — closing new deals — but one is completely in your own hands while the other relies on some outside influences. If you find that a previous goal didn’t work for you, don’t be afraid to rip everything up and start from scratch. Ultimately, you should aim to set the best goals for yourself, based on your job duties. Always Look Forward Give yourself enough time to feel the weight of stress lift off of your shoulders, and refocus your attention. Then, you can begin looking forward toward what your next goals will be. Take what you have learned during the process of completing your original goal into account, and use it to inform future goals. In our professional lives, we’ll never stop chasing goals. There will always be a new carrot at the end of the stick, helping to focus our actions. When you successfully complete a goal you’ve been chasing, take the time to first enjoy your success. Start setting and achieving goals with BrightGauge.

Goals, easy to set, very hard to follow through on. We all love to aim high. We feel almost noble setting such high expectations for ourselves. If you keep failing to achieve your goals, it may be time to alter your expectations. This will serve you well in many areas of your life, but that’s another blog post for another company to write. If you’re like the majority of humans, you fall prey to the “I’ll start tomorrow” mindset. Human nature, am’I’right? If you tend to keep missing the mark, we have a few sure ways to help you keep on path to achieving your goals. Before we begin, there’s one thing you need to let set in. Don’t let a missed goal negatively affect you or your team. If you are setting goals the right way, you should miss them every now and then. These things happen and tend to show us where we could stand to make improvements elsewhere. Missing them repeatedly despite working hard to achieve them is more of a sign of problems in your goal setting process than it is a reflection of the ability to get the job done. At BrightGauge we like the SMART goal framework... Specific. Does your goal refer to an important, well-defined part of your job? Measurable. Can your progress be measured? You must be able to mark your progress and have a definable line of success for each goal. Achievable. Can your goal be realistically achieved? Goals should be difficult, but not so difficult you repeatedly fail to complete them despite giving your best effort. Relevant. Is your goal relevant to your job? Is it a results-based goal that will help you and your company? Time-bound. Is the goal attached to a specific timeframe? There must be a definitive end to each goal period. While sticking with this, we also like to refer to the Objective Key Result (OKR) framework, which is widely used in the tech community. This helps us to be sure to identify our objectives and define their measurable results at the outset of goal setting. So before getting down on yourself about a missed goal, consider whether you’ve set the right goal to begin with. As you evaluate your goals, take the following into account. Reevaluate Your Goals As you progress towards accomplishing your goals, step back to evaluate whether you’ve set an outcome or process goal. Outcome Goals are the end result of what you’re hoping to achieve. Ex. A salesperson may have an outcome goal to make 20 new sales in one month. Process Goals cover the steps taken to reach your desired outcome. Ex. That same salesperson may set a goal of contacting 10 prospects per week to reach their outcome goal of making 20 new sales this month. Take a look at a goal you recently missed. Is it an outcome or a process goal? If you had set an outcome goal, re-working the goal as a process goal can be a great way to improve the achievability of the goal without changing the larger reasoning behind it. In general, most goals we set should be process goals. We are in control of the processes we apply to our work. Completed outcome goals are always the result of solid processes. Setting excellent process goals provides you with the foundation for hitting those larger outcome goals without having your success or failure directly tied to them. Review Goals Regularly At BrightGauge, we review all goals on a weekly-basis to ensure we’re staying on course. If the trend seems to fall out of the timeframe we projected the goal’s course to run, we reevaluate. We find it beneficial to include these reviews as part of your team’s weekly meeting or at least an email sent to the team with an update should be reviewed. You’d be surprised at just how helpful it is to have other people holding you accountable for the promises you’ve made to yourself. Or just knowing that they will be asking themselves “why” if you are behind will keep that motivation going. It’s ok to step back, and insert change. Better to pause than to stay on the wrong course. By reviewing goals every week, you’re more likely correct when needed—and actually continue taking steps towards achieving that goal. None of this “let’s start today and pick it back up next week” stuff! Goals exist to effectively insert change into any routine. Same Goal, New Strategy Goals can change, priorities can shift, things get stale when they run-on for too long. You will never reach a positive outcome if you let yourself get down about past missed goals. If you continuously fail to reach a set goal, maybe you’re just aiming too high. Being ambitious isn’t such a bad thing, but setting goals that aren’t attainable does wear on you over time. If you find that you’re not hitting the mark, try to break it down into mini-goals. If you surpass your goal each time, maybe it’s time you step it up, and aim a little higher. We get by on a little reward here and there. So set your goals right to celebrate more wins.
Everything slows down during the holidays, which makes for the perfect time to review the KPIs that we rely on daily/weekly/monthly. The reality is KPIs can feel stale after a certain period of staring at them. That can be tough for any of us to admit as those same KPIs once were so invigorating to discover, build, and showcase. As we always preach at BrightGauge though, there needs to be a periodical review of KPIs to measure their true impact. The holidays are a perfect time for that. The world changes so fast in small business that something relevant 6 months ago may not be the most pressing item right now. Just this week, I asked our dev team to review their weekly goals that they track within BrightGauge. I suggested they just delete them all and start fresh in the new year (I was talking about 6 KPIs in particular). After a quick review, I got these two responses back: I was curious to hear what they would say after I asked them to delete them all. It was awesome to see them dig in to keep two. Mission accomplished. We got rid of 4 KPIs that are no longer critical to monitor. My suggestion is for you to do the same with your KPIs and team. Run through all of the dashboards up on big screens, client reports being sent, and goals being checked in on weekly. Kill the ones that aren’t necessary and set new goals for the new year. Happy Cleaning!