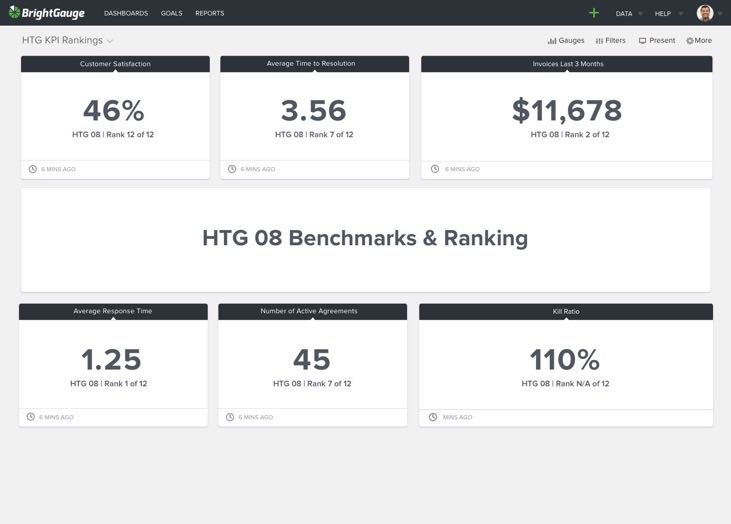
If you’re looking for a way to compare KPIs with others in your peer group, we think you’ll like our latest feature. See Where You Stack Up With Peer Group Benchmarking Many MSPs and IT Service ...
If you’re looking for a way to compare KPIs with others in your peer group, we think you’ll like our latest feature. See Where You Stack Up With Peer Group Benchmarking Many MSPs and IT Service providers participate in peer groups to share industry knowledge, identify best practices, and to work toward achieving individual organizational goals by sharing innovative ideas, or connecting with others to offer support or complementary services. With BrightGauge's Peer Group Benchmarking, those who participate in these peer groups can track KPIs ranked against their group in real time! This can help determine how a team is meeting business goals, where the team is slipping, where standards should be met, and much much more! The Benefits The data displayed within these gauges gives you a summarized view of where a company ranks but by drilling in, a visible ranking of all companies in the group gives more insight on how much is needed (or not needed) to improve. The values are synced in real-time but your total Benchmark Value, which determines your overall ranking within the peer group, is synced daily at 3:30AM. We’re really excited about this feature as we know many of our customers love to compete and love to know how others are doing. With our Peer Group Benchmarking gauges, we take the guesswork out of tracking these KPIs (and any KPIs you want). A Simple Setup It’s easy to locate an established peer group. On your dashboard, simply go to your account general settings tab, and locate “Benchmarking.” When you click on that tab, fill out the form to be added to your peer group. After you complete and submit the form, your status will be pending until your company is confirmed as a member of the peer group. We don’t want anyone sneaking into the wrong group! Once your submission is approved, you will be notified and allowed access to the Benchmarking Gauges for that group. It’s that easy! Not to worry, we make it easy to change peer groups at any time. Simply request a change, and you will be removed from the current benchmarks before you are added to a new suite of markers (as soon as you are approved for that group). That’s a wrap, if you’re in a peer group and not using BrightGauge, we don’t want you left in the dark! Contact us at BrightGauge to learn more about how your business can benefit from using our Peer Group Benchmarking tools.
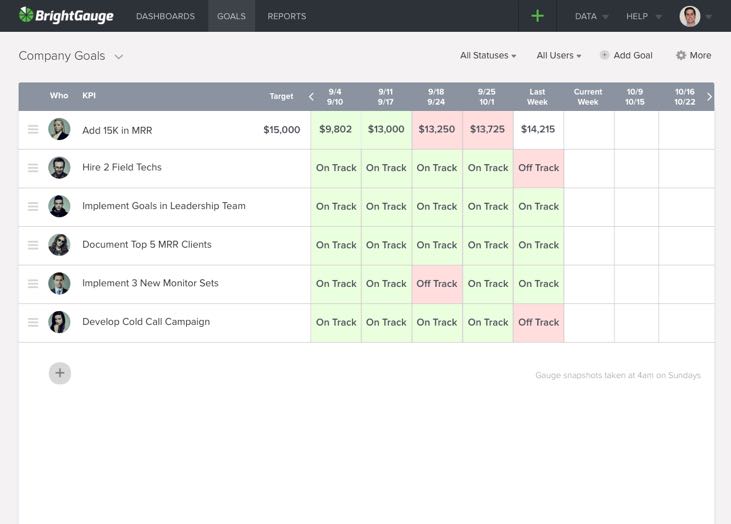
You can now track all of your company’s goals in BrightGauge! That’s right! BrightGauge Goals, formerly known as Scorecards, is an all-encompassing Goal Management system where you can track all of your company’s goals in one place. If you use EOS or Gazelles within your business, keep reading as you can now manage both your Scorecards and Rocks in this same module. For our HTG partners, managing goals set by HTG and keeping your team aligned on them has never been easier. Why Goals? Goals have always been a personal passion of ours. At BrightGauge since day 1 we have believed that being transparent and accountable with everyone on the team with our KPIs and goals will keep everyone aligned and motivated. We are pleased to say that over the last 6 years of growth we have been proven right. Fortunately, our top tier customers have felt the same way and have either implemented a formal goals program (such as part of EOS) or have been asking for a way to organize their goals so each of their team members are on the same page. Whether you call your goals “Rocks”, “OKRs”, or “SMART Goals”, it’s all about setting a goal for the company, the team, or the individual and holding someone responsible for reaching that goal. Process vs. Outcome Goals Not all goals are created equal and this is where BrightGauge Goal Management really shines. With this launch we have done two things to better differentiate two types of goals: Changed “KPIs” as they exist now to “Process Goals” Added a new Goal type called “Outcome Goals” An Outcome Goal is what you want to achieve (e.g. lose 5lbs, we’ve all said it) whereas a Process Goal is focused on the process by which you can achieve your Outcome Goal. A Process Goal for the lose 5lbs example would be walking 10,000 steps a day or hitting the gym 3 times a week. You can more easily control the Process Goal than the Outcome Goal, but it’s really important to have both. For our EOS fanatics out there, a Process Goal is your Scorecard KPI and Outcome Goal is your Rock. Works like a charm! And you can rename the collection of Goals to whatever you want. Weekly Check-ins The secret sauce with the Goals feature set is that we help keep you and the team accountable with your goals weekly. Accountability is the #1 challenge with not hitting goals! At the end of every week, BrightGauge Goal Management will email everyone who has a Goal to remind them to check in their Goal status. If you have chosen an Outcome Goal, you will be presented with an option to decide whether you are On Track vs. Off Track for the Goal. We cleaned up this interface a bit so it’s faster to check in and also to encourage adding context to every Check-in. A summary email with the Goal context included is then emailed to everyone (including any Viewer who has access to the Goal List). All the History and Context Together in One View This launch includes a new consolidated Goal Detail page. In this page, anyone with access to the Goal can easily see the Goal details and history of Check-ins with context all in one, easy to access location. We Made It Easy to Get Started We know it can feel a little daunting to venture into goal setting territory with your team for the first time. In order to ease this anxiety and pain point for our customers, we asked for feedback from our customers on what goals they use in their company to keep their team accountable and aligned. From their answers we curated a list of Goals organized by team. We called these Goal Inspirations! All you have to do is select a few Goals, put a target number (if it’s necessary), and assign yourself or someone else in the company. Of course these are just inspirations... you can adjust titles and descriptions as you feel necessary. Goal Filtering For our power users... this feature is for you! We know you want to create Gauge-based Goals for each of your engineers and/or salespeople (e.g. utilization weekly) and now you can! With Goal Filtering, we made it easier and faster to create multiple Goals based on the same Gauge. To utilize Goal Filtering, click on the filter icon next to the Goal name and you will be presented with an option to pick any text field from the Gauge’s Dataset. The text filters work just like they do in the Gauge Builder and are applied to the entire Gauge. Now you can quickly create multiple Goals powered by ONE Gauge and filter it at the Goal level. This is a big time saver and a way to assign everyone a similar Goal powered by just one Gauge. We had a busy 12 weeks of working on Goals, including pausing to stay safe during a major hurricane, but we’re really excited to have this important feature launched! We hope you find it as advantageous and valuable to your company as we have found it to be in ours. As always, let us know if you have any questions or would like help implementing Goals in your company.
When it comes to the questions our customers ask us here at BrightGauge, there are a handful that are extremely popular. Two of those questions revolve around which metrics should I be monitoring, and what is everyone else tracking? So we asked Karl Fulljames, VP of Operations at Nucleus Networks, and BrightGauge power user, to shed some light on the gauges created from his ConnectWise data and used in internal reports. The Nucleus team is made up of about 45 staff, and they have offices spread across Canada in Victoria, Vancouver, Toronto, and Montreal. Karl is a long-time BrightGauge customer and often a beta tester as well. The gauges that you’ll see here were originally shared with the community during our Managing Productivity of a Service Team webinar, which is also available for you to download in its entirety. Let’s dive in for a closer look! Editor’s note: Because these gauges are from Karl’s internal data, some info has been blurred to conceal sensitive details. Using ConnectWise Data to Improve Service Ops 1. Incident Summary (Previous Month): This metric shows you the number of incidents per item, for one particular client and it indicates that something is broken. As Karl explains, note that there are 3 tickets in the Outlook category, and 4 tickets in the Mail category for a total of 7 (more than any other category). This suggests that there may be reason to dig in and see what's at the root of these tickets. Pro tip: The Nucleus team looks at this chart on a per-client basis per month, as well as across all of their clients, monthly, to see if there’s a trend, such as a bad patch that they didn’t detect, or an Office 365 issue, etc. Also, drilling down to per-client level is really useful for finding out what’s happening in that client’s environment. This part of the report generally stays fairly static, but some months there will be a jump and the Nucleus team is alerted that they need to dig into the details. Want to learn Karl’s reasoning behind these incident categories and how they were selected? Hear the entire discussion in the Managing Productivity of a Service Team webinar. 2. Incidents by Client Previous Month: Here you’ll see the number of incidents per client in the previous month… or as Karl puts it, which clients have the most things broken or burning. This gauge indicates which clients to do a root cause analysis on, so that you can figure out what’s actually causing those tickets to be created. Doing this analysis leads to future project revenue and also reduces overall support hours! Pro tip: If a client is putting in 51 tickets as you can see on the right side of the chart, then they probably have a lot of stuff broken. However, Karl cautions that the number of tickets is not actually the best indicator of what’s actually happening. That’s why you should also use... 3. Incident Hours by Client Previous Month: This metric will show you if the client who submitted the most tickets has issues that are fast and easy to solve, or it will highlight clients who have only a few tickets, but take a significant amount of time to fix. This is the better indication of what’s actually broken for each client! Karl explains that because the number of tickets does not indicate which client is busiest, you need to make sure that you’re checking a couple of different gauges to get a better idea of what’s actually going on. For example, the top client in the previous Incidents by Client gauge, with 51 tickets, didn’t even break the top 10 when viewing the data here. Pro tip: Each month the Nucleus team will focus on the top 5 busiest clients that they can reduce hours on, because they charge a fixed price per month, per client. As a result, it’s in their best interest to make problems go away, forever. In the first month Karl implemented this gauge, he realized that a mid-sized client had 60% of their hours going to supporting their FTP site, which wasn’t noted before because the Nucleus team has so many techs doing different types of work. Consolidating the data led to a much better solution which the client was happy to pay for because it resolved all of the support issues. 4. Config Items and Tickets Previous Month: By adding config items and tickets together, it’s very easy to see the number of hours spent on a certain piece of equipment in the previous month. This type of data drives down hours because you’ll easily notice what needs to be looked into. For example, Karl sees this data and realizes that a SQL server cost him nearly 17 hours last month. Perhaps it’s old and needs to be replaced, maybe there was a cryptovirus, or a bad backup - whatever the reason, he knows that they shouldn’t be spending anywhere close to this much time on it. However, with this data at hand, it’s easy to see what needs to be addressed, which gets rid of a headache for the client, but is also a huge win for Nucleus. By fixing the top 10-12 issues through a project, the team earns extra revenue, and the problems and hours spent fixing those issues go away. Pro tip: A use case scenario would be for clients whose users roam around from desk to desk, not on dedicated machines. By adding the config item to the ticket, you’ll know if the workstation is having an issue. Holding Your Service Team Accountable 5. Support Team Hours (chart): Shows you where each team member is spending their time, with a breakdown of project hours, support hours, internal work, and absent time. Karl sends this chart directly to each Tech... daily, weekly, and monthly. At Nucleus, every Tech should show 37.5 - 40 hours per week so in this case it’s easy to see who’s falling short, like the first person who has less than 20 hours for the week. This gauge makes it easy for Karl to see that it’s time to talk with this Tech so he can understand what’s going on: are they burnt out, or need more work, perhaps they don’t like their job and want to quit. Pro tip: Another benefit of this gauge is the transparency and self-policing that it promotes. Because every person on the team can see what the others are working on, they keep each other in check and Karl doesn’t have to get involved unless a red flag comes up. It’s also helpful in employee reviews because sometimes people ask how they are doing in comparison to the rest of the team. 6. Support Team Hours (table): This is a second view to show you where each team member is spending their time, with a breakdown of project hours, support hours, internal work, and absent time. Editor’s note: this gauge requires BrightGauge’s Advanced Plan with Calculated Metrics Similar to the Support Team Hours Chart above, but in this case we’re looking at a different week. The color thresholds that Karl has chosen for this gauge indicate 37.5 or less hours (red), 37.5 - 42 hours (green), and over 42 hours (purple). Karl can easily see that Tech # 1 is short a whole day’s worth of hours, while Tech # 5 went over, so he knows that it may be time to re-assign work in a better way to keep hours more even. Pro tip: The last column, “chargeable” (different than billable/support hours for the Nucleus team) indicates billing on projects, so Karl can see how much of a person’s time is being spent on project time. The numbers are based on each Tech’s timesheet they are submitting, so there’s no argument on where they stand. Managing Service Team Productivity 7. Technician Utilization Yesterday: Measures how much of each Tech’s day is spent on billable time (profit!) At Nucleus, this gauge is also live on a dashboard, but the entire team receives the previous day’s recap each morning. Monitoring Tech Utilization is another way to show which teammates need to have their work balanced for those who are well below or well above the average rate, assuming 100% utilization. Karl notes that the most important part of tracking Tech Utilization is being able to talk to the team immediately about their hours. If you wait 2 days to talk to a Tech, they may not remember... so instead, talk to them while it’s happening. Pro tip: Keeping a live view of this metric is critical because if you fall even one day behind on updating it, you can’t catch up. 8. Effective Rate: This metric is a calculation made by taking revenue from managed services agreement and dividing by the number of hours. Editor’s note: this gauge requires BrightGauge’s Advanced Plan with Calculated Metrics This is Karl’s simple version of effective rate, although he also has a more advanced version. Using this version of the calculation, if a client pays $2,000 and they use 10 hours, your Effective Rate would be $200/hour. The Nucleus gauge tracks Effective Rate by previous month, previous 3 months, and previous 12 months, and obviously the more hours spent on a client, the more the Effective Rate goes down. Karl notes that there are many ways of making this calculation, including the ConnectWise version and the BrightGauge version. Shameless plug: he also confirms that the BrightGauge version is the way to go, after getting schooled on a bit of algebra from our very own teammate, Randall. Trends are especially important to note when it comes to Effective Rate. If you have a client with a really good Effective Rate and it’s increasing over time, then you’ll want to do more of whatever it is you’re doing. If you have a client whose Effective Rate is declining over time, it’s a huge indicator that you need to get in front of whatever is going on. Did they add a bunch of people, and you didn’t realize it? Did they change their business strategy? Whatever the reason, the point is that they’re creating more tickets and costing more hours. Pro tip: The questions you want to ask yourself are: What are your effective rates? What is your break even? What is the goal you're aiming for? Next steps for internal reporting With 8 awesome new gauges to be made from your ConnectWise data, are you ready to learn more? Karl shares 7 additional gauges, plus his resolve and close procedure, top metrics used by the Nucleus team, and tons of other insights in Managing Productivity of a Service Team, an on-demand webinar.

“How often are you meeting with your team?” was the burning, top-of-the-list question during our journey to understand the best practices behind growing an MSP sales team. We sat down with Nate Austin, VP of Business Development at Mytech Partners, to gain some first-hand knowledge on the matter. Since 2000, Mytech has grown from an idea into an MSP with 3 offices and 90 employees spread across Minnesota and Colorado, and the leadership team picked up a lot of tips along the way. As we learned from Nate, your one-on-one meetings should be weekly, but there are two different kinds of one-on-one meetings you should have: deal strategizing and coaching - which is popular among business owners - but owners often lose sight of the second one, which should focus on accountability. Join us for a conversation all about MSP sales teams: the qualities to look for in a good salesperson, how to train them, onboarding advice, KPIs you need to know, and more! How to Build an MSP Sales Team + the KPIs You Need to Know: Episode Highlights Nate’s intro and background (0:50) A typical day as VP of Business Development (4:44) The demographics of the Mytech Partners team (6:56) Leveraging multiple help desk teams (10:02) How do you package and price your managed services offerings? (15:20) The qualities of a good salesperson in the managed services business (18:15) How do you train salespeople to identify a business need and match to a solution? (21:24) Nate’s onboarding advice to make sure salespeople are successful (24:14) A closer look at Mytech’s Sales Team meetings (27:34) KPIs and tracking performance for the Mytech Sales Team (30:29) High level steps in the sales process (38:45) Q&A: Best business book, favorite resource for personal development, parting advice for MSPs, how to reach Nate (44:32) Book mentioned in the episode: Leaders Eat Last: Why Some Teams Pull Together and Others Don’t, by Simon Sinek Want to find out more about The BrightGauge Podcast? Check out all the episodes here.

I don’t know about you but the first thing I do on Monday morning when it’s time to get to work is check two things within BrightGauge: Our Company Goals Dashboard The Leadership Team’s Scorecard Our Company Goals Dashboard Our Company Goals Dashboard includes the most important KPIs to get a snapshot of how our business is performing compared to the goals we have set for the year. The dashboard includes the following KPIs: Signups MTD: how many customers signed up this month Churn MTD: how many customers canceled their subscription Net New MTD: the difference between signups and churn for the month Active Accounts: total number of customers we have Net New MRR YTD: total new revenue booked, minus total revenue lost YTD Net New MRR QTD: same formula as above but prorated for the current quarter’s goal The reason this dashboard is so important is because at the beginning of the week I can see how we are tracking towards our monthly goals (signups and churn), our quarterly goal (Net New MRR QTD), and ultimately how that rolls up to our annual company goal of New New MRR. We have a company-wide bonus based on the Net New MRR for the year so you better believe everyone is working towards hitting those goals. The Leadership Team’s Scorecard Once I see how our company is performing financially I like to jump into the weekly operational scorecard for our Leadership Team to help identify if there are any areas that are “off track” and need to be addressed. This scorecard includes the KPIs for each area of our Leadership Team to ensure they are on track. Customer Success It all starts with Customer Success because without that we have no business. The 4 KPIs we monitor for Customer Success are: CSAT: Customer Satisfaction scores for our team’s interaction with Customers Health Score Less Than 20: what percentage of customers have a score under 20 Churn Revenue Lost: how much revenue was lost/canceled Tickets Escalated to Product: how many tickets needed to get the Product Team involved Sales There is so much you can monitor regarding sales but at this level we focus on the high level KPIs: Signup Revenue: amount of revenue booked from new signups Upgrade Revenue: amount of upgrade revenue booked from existing customers 30/90 Ratio (LGAR): lead velocity calculation Marketing In order to support Sales efforts we need a certain amount of leads delivered each week, so the KPIs we track are: Leads: number of new leads Marketing Qualified Leads: number of leads that requested a demo or to speak with sales Finance This is a pretty easy one to track and our most important KPI each month is: Past Dues: amount of subscriptions past due Product Our product is the foundation of everything we do and tracking the team’s performance each week gives us a good indication of how productive they are. The KPIs that matter most for them at this stage are: Bugs Reported in ZenDesk: no one likes bugs, so we want to know when they happen and how many Points in Backlog: number of efforted points ready to be worked on to ensure they have a pipeline of work Sprint Points Moved to Production: number of points pushed to production which indicates the amount of work the team accomplished Efforted Points: number of points added to the backlog after the team reviewed and gave an estimated effort Engineering Making sure our application is not only running, but running smoothly, is critical for everything else to work so the KPIs we monitor for that are: Downtime in Minutes: number of minutes the app is down SIP Points Moved to Production: number of points related to security, infrastructure, and performance added to production Tying it All Together Every business has their own Key Performance Indicators (KPIs) that they need to monitor so this overview isn’t a “one size fits all” but the important thing is to select the data that matters most to your goals, and then build up from there. To learn more about choosing the best metrics to monitor for your business, download our guide to KPI Best Practices:

70+ Metrics for MSPs
Key metrics and accompanying formulas to help MSPs skyrocket growth and success!
Get your KPIs

Have you found that your margins tend to erode the longer that you stay with a client? It’s a common issue that many MSPs face. Over time, as client’s needs change, the services rendered change as well. Often, this doesn’t come with a renegotiation of the managed service agreement in full, but rather a small amendment. As your services change, so too do your margins. Historically, many MSPs employed a model of remote management and monitoring. They supplied and managed a range of hardware solutions for their clients. They also often sold new hardware to a client as part of an initial infrastructure upgrade during the onboarding process. Now, as more clients shift toward cloud-delivered solutions, MSPs must find new revenue streams to replace old ones. These issues combined with lowering your prices to compete can be a deadly combination. Competing solely on price overlooks the areas of your business that you have put blood, sweat, and tears into developing. Those areas should be the selling points that differentiate your company from your competition. Valuing your services appropriately entails a lot more than simply comparing prices with a competitor. As any MSP owner knows — there is a lot more that goes into delivering a top-notch managed service than most would assume. Let’s take a look at some of the strategies that MSPs can employ to avoid competing solely on price. Niche Your Company as a Vertical Specialist Want to attract the kind of clients that understand your value and are willing to pay top dollar for an exceptional service? MSPs can charge more by specializing in a particular vertical. Healthcare, retail, law, or other professional services are all popular verticals. Not only does this position your company as the ideal solution to companies in that industry, it allows you to focus on the specific skill sets that will resonate with those prospects. For instance, offering managed services to companies within the healthcare industry comes with its own set of considerations to maintain and facilitate HIPAA compliance. The same is true for servicing law firms. Niching your company as a specialist within a particular vertical may feel like you are pigeon-holing your business and scaring away clients outside of your chosen vertical. In truth, you’ll rarely find that specializing makes generalist clients apprehensive but goes a long way toward attracting clients within that industry. You put yourself in a position to compete on expertise, rather than on price. Target Specific Software Solutions or Vendor Programs Another excellent way to stand-out by niching down is to specialize in specific software solutions or vendor programs. In some cases, this software might only be present in a particular vertical. By marketing your MSP as specializing in a specific software solution, you make it easy to stand out against the backdrop of generalists. Prospects will immediately see that you are a good fit for their business. By building a verifiable track record in specific software stacks, you have proof to back it up as well. As time goes on, your familiarity with specific software solutions will genuinely make your company a more effective choice than the competition. Facilitating these skills and areas of expertise among your teams allows you to compete not on price, but on expertise and real business benefits. Use Real-World Examples to Highlight Service Divides with Competitors When negotiating with prospects, placing too much focus on price can be detrimental. Yes, nearly every client that you speak with will be concerned with the price of your services on some level. But, delving into your price compared to that of your competitors without looking at the reason for those differences is a recipe for margin erosion. You have likely seen competitors lower their prices over time to stay competitive, and it can be tempting to follow that same path. Instead, focus on the differences in service quality and coverage when discussing the differences in price between you and competitors. What do you bring to the table that makes your service worth more? Do you have stats, case studies, or analytics to back it up? Often, you may find that the examples that connect with prospects might be a bit outside the norm. In a recent conversation with Josh Kotler, CEO of Western Digitech, and long-time BrightGauge customer, we discussed this exact topic: “It’s not about price, it’s about the results you deliver,” Josh said. He then went on to give an example that he uses to drive home this point with new prospects. Let’s assume that the average system takes 6 minutes to boot up and login every morning. Generally, employees will go grab a cup of coffee and engage in some water cooler chat while waiting. In total, it might be as much as 15 minutes or more until they are at their desk and ready to start. That’s 15 minutes of time lost. A smart MSP might notice these inefficiencies, point out that their changes would have the system ready to go in just two or three minutes, and point to the boost in productivity for every employee in the company — a measurable improvement. Process is the Differentiator Ultimately, end users don’t leave their MSP because they are running into technical problems or take issue with the price points. Those are just a symptom of the real problem — a lack of business results to justify the investment. They aren’t upset that their user ran into a technical issue. They are upset because of the extended period of downtime that they incurred as a result of that problem. In that same conversation with Josh, he broke it down plainly. “Everything we’re doing is about risk and efficiency,” Josh said. He elaborated further, saying that the priority is always to get the end user back on track and working again. He mentioned how this was especially true for companies like law firms, who bill by-the-minute. For them, fast-fixes are crucial to resuming business and maximizing revenue. It all comes back to process. Not only the processes that you use to quickly resolve tickets but the process of identifying the root problem that caused the issue so that it can be addressed after the ticket is closed. Those processes ensure that you can avoid similar tickets in the future and provide measurable business impact to your clients. Position the Solution, Not the Ingredients Most MSP clients don’t care how something is done as much as the result that it achieves. That means that in the case of an average client, don’t focus on selling the cutting-edge tools and software that you use — sell the benefits that the software creates for your clients. (The exception to this being niche markets who know of the specific softwares for their industry.) Sell business results and peace of mind, not the technology that drives it. Having access to new and innovative technologies is great, but only if they facilitate your company providing better results than your competition, which should be the focus of any negotiation. Moving Forward As clients begin to shift toward cloud-based solutions, it is important that MSPs are able to diversify their revenue streams and position themselves to charge higher prices. To do that, you have to place less focus on price and more focus on the business outcomes. Do you have a success story to share about focusing on business outcomes instead of price when it comes to selling your MSP services? Tell us in the comments below.
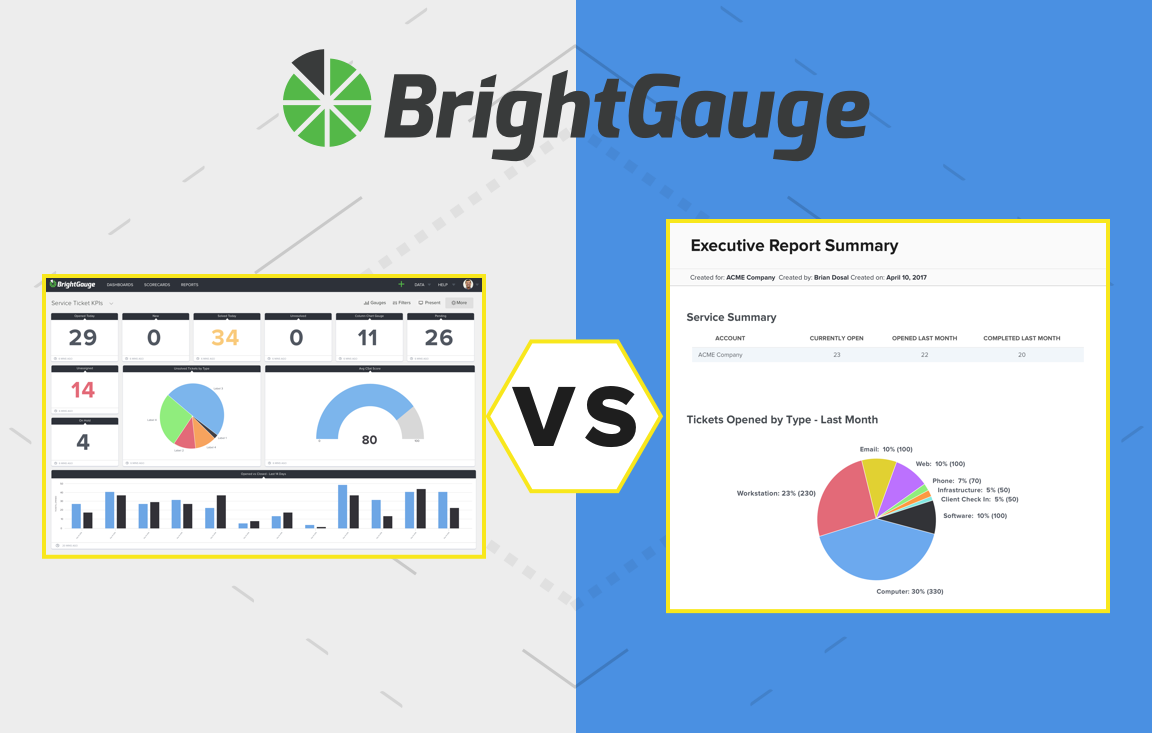
While dashboards and reports often feature the same information, the way in which they are used can actually be quite different. It’s a topic that comes up from time to time within our community, as users try to figure out which option is their best bet. To help you decide, we’ve put together our best tips based on different scenarios. In short, the best way to decide between a dashboard and a report (learn more about choosing dashboards vs. scorecards here) is to decide what you’re trying to achieve. Let’s take a closer look: The Best Use for Dashboards At BrightGauge, we always say that dashboards are the cornerstone for providing a complete picture of the health of your company. Because dashboards are extremely customizable, you also have control over what data points you show, and they’re flexible when it comes to your decision on whether you provide daily, weekly, or monthly insights. Dashboards have quite a few benefits that you'll notice when using them: Real-Time & Right Now BrightGauge dashboards allow business owners to select their most urgent KPIs for monitoring, which means that you always know what needs your attention, in real-time. That means no more looking back on your performance in a P&L at the end of the month, wondering what went wrong. Keep your team in sync Another benefit of choosing to display information through dashboards is that you can ensure that your entire team is on the same page. When each team member has job-relevant data on a heads-up display (HUD), all they have to do is glance up to see how their team is trending in real time. A great example of this would be displaying customer satisfaction (CSAT) data on a dashboard for your Service team to monitor throughout the day. Sleek addition to your office decor One of the most popular use cases we hear from BrightGauge customers is that they love to display their dashboards on the wall where they are easily seen during site visits by their prospects. Not only do they look great, but it also shows your potential new customers that you have a handle on your business and your team! Our friends at Nucleus Networks share their beautiful office + dashboard view Increases transparency Employees love to know the inner workings of the company that employs them. Dashboards are a great way to provide transparency to your teams. Allowing your teams to plainly see the advanced KPIs provides insight and gives them the opportunity to better understand the reasons behind business decisions. Drives efficiency Efficiency is critical for the success of any business, but it’s especially a hot topic for any service-focused roles. Often, individual performances play a measurable role in the success of any team and dashboards help because they provide a complete top-down picture of both what is working and what isn't. With this information easily accessible, it’s also helpful to management for addressing which points need to be improved and when. Saves time Traditionally, business owners would have to log into multiple platforms to check their metrics, or ask an analyst to put together a report, both of which can take a significant amount of time. BrightGauge dashboards provide you with a complete picture without the hassle of having to hunt down the data. When all of your KPIs are in one spot, you can use your precious time for other things! The Best Use for Reports In some situations, a report might be the right choice over the dashboard view. Reporting makes it easy to examine trends and show clients the value of the services you provide, plus they also help to address any questions your customer may have - often before they arise. You'll see these benefits when using reports: View a Point in Time While dashboards are perfect for reviewing up-to-the-minute data, reports are ideal for looking at data from a specific time. As an example, if you wanted to export specific data points from your accounting and RMM softwares from a year ago, a report would be a faster, simpler option for generating that data. Push the Information BrightGauge reports are a great way to share information because you set them up once with all of the data points you want to send, and then schedule the regular intervals at which they will be delivered. Need to send your client a weekly recap of your work? Put together your report, schedule the day and time it should be sent to their email, and you never have to touch it again unless you want to make changes to the report. Want to share your KPI progress with your leadership team? Again, set your report up once and your team will have a full update delivered right to their inbox. Great for historical & trending data Reports are perfect for historical and trending data. While dashboards are the best option for real-time overviews, reports allow you to examine specific timeframes with ease. This makes reports an excellent choice for tax season, or for getting an idea of trends within your company or market. Increases Transparency While dashboards are the best bet for offering transparency to your team, the tables turn when you want to keep your clients informed. For clients, reports are a great way to ensure that you always have concrete proof of how valuable your work is. In a managed service business for example, reports are a great way to show clients that SLAs are being met. Drives Efficiency Like our dashboards, reports can also be a great way to examine efficiency and find ways to improve. For instance, if you wanted to show your customer service team that their response times had slipped in recent months, pulling historical CSAT data into a report is the simplest way to do so. When employees can see this data in front of them, they will be more likely to self-correct and examine their own efforts. Saves Time Reports are huge time-savers because once you create and save one, you never have to touch it again unless you want to make changes. If you’ve ever had to spend hours of your time pulling data from multiple sources, crunching the numbers, adding them to a spreadsheet, and maybe even trying to create charts out of that data, then you know that process is a headache waiting to happen. Reclaim hours of your time, and skip the pain relievers with an automated report that will do all the work for you! Next Steps for Mastering Dashboards or Reports There are reasons why both dashboards and reports are excellent features for our customers. Dashboards are the best tool for keeping tabs on your day-to-day business metrics, while reports are excellent for examining historical and trending data. Both give users the ability to customize their output and automate their updates as often as needed. Ready to learn more? Download our webinar recordings: Dashboard Best Practices and Client Reporting Best Practices.

Referrals are the most valuable types of leads for any business. A recommendation from a trusted source is a vote of confidence for your company. Referral leads come to you with a certain level of trust built-in, but learning how to ask for referrals can be difficult for business owners. If you don’t have a referral program in place, the best step that you can take is to ask your current clients if they know anyone that might be interested in your services. It can be a bit nerve-racking the first time that you ask. After all, you don’t want to put your clients in an uncomfortable situation. This is a common fear but is often an unfounded one. Remember that when you provide a great service, your clients will often be happy to recommend you to trusted friends. They will also see the recommendation as a way to build trust and further business relationships with the referred party. If you would like to attract more referrals from existing clients, here is a step-by-step process for starting the conversation. Step 1: Remind the customer of the benefits you provide Asking for a referral isn’t a big deal when you do great work that your clients love. Sometimes they may need a bit of a nudge to remember exactly how much value you provide to their business. By encouraging them to think about the value you bring to the table, you can push them to consider other business owners that might be interested in the same. Partnerships that provide a valuable return for them may also be valuable assets to their business connections. Step 2: Describe your ideal customer Every business owner knows what a nightmare it can be to take on the wrong client. It's always best to focus your efforts on a client that would be an ideal fit. Making the industries or types of companies that you work with clear can prevent a lot of headaches down the road. Additionally, you want to point your clients in the right direction as they consider possible referrals. Let them know exactly what type of businesses you are interested in working with and see if they know anyone that might fit the bill. Mentioning your ideal client can jump-start brainstorming that leads to a recommendation they would have otherwise overlooked. Step 3: Identify a benefit for the referral People are a lot more likely to help out a friend when it is mutually beneficial. Consider ways to provide value in exchange for a referral. You could offer them a small discount, provide some services for free, or even send them a finder’s fee for helping you to secure a new account. You don’t have to go overboard, but providing a small return in exchange for a referral can make it that much more worthwhile for current clients. Remember that some clients will see benefits in simply making the recommendation. Helping other companies improves relationships and strengthens bonds. Drive home how valuable the referral process is for all parties involved. Step 4: Suggest someone they already know Managed service providers often have a lot of insight into their client’s businesses. You may be aware of a few different companies that they work with, or have insight into their broader business relationships. If you know that they have a connection to a company that your services would benefit, there is nothing wrong with making the suggestion. Be active in the companies that you target for referrals. After all, your client may never think to recommend you to a friend on their own. Step 5: Ask for an introduction Once you’ve identified that they know someone who might be a good fit, be forward. Ask for an introduction. Nine times out of ten, your client will be happy to, at the very least, introduce you or outright recommend your service. You've spent a lot of time building a positive relationship with your clients. It would be silly not to leverage those relationships for more business. An introduction in itself is valuable even if it doesn’t result in the sale, as it creates familiarity and could lead to a sale down the road. Don't skip the follow through! Although it seems like common sense, make sure that you follow through. Call the referral when you say you will. Promptly provide any benefits that you offered in exchange for the referral. Put together proposals in a timely fashion. With the built-in trust that you have from your referral, displaying reliability, professionalism and follow-through can go a long way toward sealing a new contract. There is no quote that shows the importance of asking for referrals more than this one: “91% will give referrals if asked. Only 11% will ask.” - Dale Carnegie Want to learn more about how to identify your ideal customer? Download our webinar, featuring MSP Coach Richard Tubb:

One of the biggest struggles that our clients face is finding new and innovative ways to market their MSP business. The industry has grown rapidly in recent years and that growth has brought a wealth of competition. However, there are some simple steps that any managed service provider can take to stand out from the crowd and make their marketing budget stretch further. A few simple steps that any MSP can take to improve their marketing efforts include: Outsource Until You Can Bring In House A critical mistake that many growing MSPs make is being too quick to build an in-house marketing team. While an in-house team is a goal for new companies and a requirement for larger organizations, MSPs shouldn’t be in too big of a rush. Bringing on an in-house marketing team can carry significant risk. Often, it is a better idea to refine your marketing strategies while outsourcing before building your own team. MSPs make their living by pitching the outsourcing of IT services to their clients. Why wouldn’t they take their own advice when it comes to marketing? Additionally, many companies make the mistake of bringing together an internal team one piece at a time. This often leads to a situation where a single person must manage the full scope of the company’s marketing efforts, which is often too big of a job for one person. Instead, consider hiring a person to manage your outsourced marketing. That person can work with agencies and freelancers to put together effective marketing strategies and test new ideas. Cover the Basics, Then Expand Excited MSP owners may be tempted to jump straight into the deep-end of the marketing pool. The problem with this is that they jump in before they learn the front stroke. While it might be enticing to ramp up your digital strategy on multiple fronts at the same time, ensuring you have your basics covered gives you a foundation to build on. That foundation makes all subsequent marketing more effective and facilitates better business decisions. Start with the small things. Update your website with a modern design. Create some helpful and interesting content about your products and services. Give your prospects a place to learn more about your company. Make sure that you give those prospects several ways to contact you, including through phone, email, or consultation request forms. Once you have a solid foundation laid, you can then begin to invest your marketing budget in other areas that will drive visibility. Marketing KPIs No MSP should begin investing heavily in their marketing without first outlining what would make their efforts successful. How do you measure success in marketing? Start by outlining a few key performance indicators that will help you to track your effectiveness. The KPIs and metrics that we typically recommend to clients include: Total website visitors. How many people are landing on your website? Where are they coming from? What are your visitor trends telling you? Total website visitors is a good gauge of how well your marketing is performing generally and provides insight into your marketing operations as a whole. Total landing page visitors. How many people are actually seeing your lead capture forms? Knowing how many visitors are taking the next step provides insight into how qualified your traffic is and how effective your content is. Number of leads. How many are filling out your forms and asking for more information? Leads are the lifeblood of any managed service provider. Lead conversion rate. Out of those that fill out your lead form, how many become clients? Are you attracting the right people to your website? Leads that convert at a low rate may provide insight into issues within your sales pipeline. Number of prospect conversations. Out of everyone that fills out your lead capture form, how many of them end up getting on the phone with you? How many are falling through the cracks? Number of opportunities from new prospects. Of those that hop on the phone with you, how many make it as far as discussing a potential partnership with your MSP? This can provide insight into issues with phone sales if you find that not many opportunities are being generated. These are just a few of the many KPIs that could be useful to MSPs or any company that does business online. They provide a starting point for tracking, evaluating, and improving your MSP marketing efforts. Next steps with MSP marketing Consistent and careful marketing is vital for keeping your sales pipeline full. However, many growing companies try to ramp up too quickly by bringing on an in-house team. You have to learn to walk before you can run. Start small, ensuring that you have your basics covered and slowly expand your marketing efforts as you begin to see results. If you would like to learn more about effectively marketing your MSP, check out our Marketing for MSPs Webinar.

In the world of MSPs, best practices and the importance of service team processes are often in the spotlight, but let’s not forget that a sales team also plays a critical role in shaping the company’s growth. At BrightGauge, we urge our MSP customers to first set the right standard for their sales team. That means encouraging your sales team to commit to strategies that promote long-term growth over short-term sales, by shifting their sales mindset toward lead nurturing. While it may sound like a huge undertaking, the secret is to have a sales processes that promotes these strategies. Let’s take a look at 5 of the sales best practices that we promote here at BrightGauge: Create colleagues One of the biggest mistakes that MSP sales teams make is focusing too much on closing the sale. That’s right. Sales are great, but building a mutually beneficial business relationship with prospects will yield better results in the end. According to a study by Marketing Donut, 20% of all clients will take 12 months or more to close the deal. Companies focused on short-term sales miss those opportunities. To foster long-term relationships, there are a few things that MSP owners should instruct their sales reps to focus on. First, focus on providing value. Whether they buy your services or not, a constant stream of value from your business helps to shape their impression. Face-to-face interaction is also important. In a world where B2B businesses connect online from across the globe, you’ll have to make face-time a priority. Emails are effective, but can only go so far. In long-distance business relationships, a video chat through Skype can go a long ways toward building a connection. Encourage your sales reps to engage in “servant sales” strategies. These strategies place priority on building trust and adding value, rather than focusing on making the sale. According to a Forrester Research report, companies that nurture leads make more 50% sales, while spending 33% less than companies that do not. Encourage your sales team to pursue relationships that may not pay off immediately, but show future promise. Establish a timeline Developing a positive relationship with a client requires that you not apply too much pressure. Pressuring the prospect to commit too quickly can ruin relationships and sour their opinion of your brand. Avoid this by encouraging sales reps to allow the prospect to dictate the timeline for the sale. This helps them feel at ease by putting them in the driver’s seat. Once you have a timeline for the ideal sale established, continue delivering value. Instruct your sales reps to regularly send relevant content. A DemandGen Report study found that 95.2% of B2B buyers preferred providers that used content to help them navigate the buying process. Stick to a process Just because an MSP commits to a longer sales approach, doesn’t mean that it needs to be without a process. Having a defined process creates repetition, allowing your sales reps to improve their pitch with each new prospect. For long-term sales engagements, a 5-7 step system can be immensely helpful to your sales teams. Of course, every engagement with a prospect is different. There must be wiggle room, but having that outline handy helps keep your team focused. Here’s an example of a system similar to the one we use here at BrightGauge, but customized for use by MSPs: Send Email(s). An email is an excellent, low-pressure way to gauge interest and introduce yourself. A few back-and-forth emails can be a great way to start building a relationship. Gauge Interest. Use a series of emails to learn about their company and gauge their need and interest. Follow-Up Phone Call. Once you’ve confirmed their interest, schedule a follow-up phone call. According to The Marketing Donut, only 2% of sales close during the first meeting, and the average sales process requires 5 follow-up calls to close the deal. Free Network Assessment Offer. A free offer is a great way to add value, build trust, and establish that your company is a good fit. Whether or not they become a client, you’ve provided them with valuable insights. Follow-Up Video Call or In-Person Meeting. Cement your relationship with the prospect. A face-to-face discussion is a great way to build a deeper connection, even if they aren’t interested in committing right away. Convey value A sales rep’s main goal should be to provide and convey value in all stages of the sales process. Taking the time to find relevant, valuable content helps to build a connection over time. Make that value clear to the prospect. When you send them content or speak about strategies on the phone, don’t be afraid to spell out exactly how it will help them. Connect the value you deliver to real business cases that the prospect understands. Aim to problem-solve The most important component of any engagement with a new prospect is ensuring that your services can solve their problem. An Impact Communications study found that 70% of B2B buyers make purchases to solve specific problems. A client that signs up for a service that they don’t truly need won’t be a client for long. In some ways, the relationship isn’t different than the one between a doctor and patient. A doctor wouldn’t prescribe headache medicine for a runny nose. If they did, they wouldn’t be that patient’s doctor for long. MSPs need to identify the best fit for their service to deliver exceptional value to clients. Evaluating their needs and ensuring that your services solve their problems will take time. Often, it isn't possible without accepting a longer sales process. Allowing your sales reps to take a long-term approach is empowering for both parties and will result in more meaningful business relationships. Learn more about long-term sales processes Interested in learning more about long-term sales processes that lead to high-value clients? Check out our Director of Sales, Larry Garcia, on Episode 2 of The BrightGauge Podcast, talking about The BrightGauge Sales Process.

Companies in any industry know the importance of metrics because they play a large part in both their daily interactions with clients, and analyzing their own effectiveness. However, it is surprising to see how much room many comapnies have to grow in the monitoring of their own financial metrics. They monitor their operations on a daily basis but wait weeks between checking on the overall financial health of the company. BrightGauge’s interactive dashboard is designed to be an all-in-one solution that will eliminate the data silo. Our system integrates directly with the most popular accounting softwares to ensure that our clients always have up-to-date financial metrics on hand to influence key business decisions. Why you need a real-time view of financial data Having a real-time view of your company’s financial metrics puts you in a position to capitalize. In business, it’s commonplace for companies to evaluate financial metrics well after the period that the metrics cover. Some don’t deep-dive into the numbers until the following quarter. Even profit and loss statements may not be evaluated for weeks after a period ends. Now, there isn’t anything wrong with evaluating quarter-to-quarter metrics. Those comparisons yield valuable data and conclusions on their own. Having that big-picture view is extremely useful. But you shouldn’t forego real-time analysis when you have those numbers readily available. Every day you make decisions that will affect the bottom-line of your business. Understanding how small decisions have a measurable impact on your financial metrics is valuable data in itself. While companies shouldn’t be too reactionary, keeping tabs on important metrics as they shift can help businesses to avoid issues that otherwise might take months to notice. By scheduling weekly analysis of your financial metrics, you'll keep your fingers on the pulse of your business. You’ll know what is working and what isn’t well before you dig into your profit and loss statements. Understanding trends in your financial data Like any important business metric, financial data will trend as changes are made. Delaying analysis makes it nearly impossible to catch and correct negative trends before they balloon into serious issues. Keeping a close eye on your financial data can help you to spot trends early and take action to mitigate or continue the trend. At BrightGauge, we’ve included features that make reviewing financial metrics simple for any business. Let’s take a look at an example of what our clients see when they login to their dashboard and sift through their financial metrics: In this example, we are looking at the Total YTD revenue for an example company. Clients are able to customize and filter or sift through the pre-loaded metrics. You won’t have to run time-consuming database crawls or ask your team to generate reports. All vital financial metrics are available directly in your BrightGauge dashboard. You can load up reports with a few mouse clicks and keep an eye on trends as they develop. Retrospective analysis is useful but can be supplemented with a more hands-on approach. Real-time monitoring improves decision-making, while comparing performance monthly can highlight areas of improvement or confirm current strategies are working. Keeping a close eye on these metrics after changes allows businesses to react to the data. This results in a swifter, more beneficial decision-making processes. Cash flow is the lifeblood of any business Cash flow is arguably the most important metric for any business. It provides the stability and flexibility that allows businesses to grow. Having a healthy cash flow allows your company to invest in new projects, prepare for disasters, and capitalize on opportunities. Most business owners know this. Why then, do so many businesses fail in accounts receivable management? According to the Atradius Payment Practices Barometer of 2014, 52% of the value of invoices 90 days past due were written off as uncollectable in North and South America. The average in Europe was 35%. The most important aspect of healthy cash flow is proper accounts receivable management. Having the right processes in place to incentivize clients to pay invoices on time is important. So is ensuring that you are staying on top of overdue accounts. Reps must communicate in a way that encourages quick resolutions. In a BrightGauge financials dashboard, we make it simple for businesses to improve cash flow. Outstanding invoices are spelled out plainly by the company, amount owed, and time past due. Take a look: Having easy access to your Accounts Receivable data helps to ensure that you have a handle on your expected cash flow. This makes investing in assets and making changes less stressful and more informed. Keeping a real-time view of your overdue accounts makes it easy to follow up personally with overdue accounts, a critical step for maintaining positive cash flow and keeping clients from falling behind. BrightGauge integrates directly with several popular financial software solutions to ensure that you always have reliable, real-time financial data on hand. How to empower your business with a single platform At BrightGauge, we believe that connecting operations and financial management in one seamless platform empowers businesses. We’ve gone the extra mile to ensure that our clients are able to connect all of their key business data in one single platform. BrightGauge integrates with the most popular business finance software in use today including QuickBooks, QuickBooks Online, Xero, and Reckon. Learn more about our Financial integrations, including QuickBooks, QuickBooks Online, Xero, and Reckon.