Managing your data is about to get even better, with the addition of Datto in your BrightGauge! Datto offers comprehensive backup, recovery, and business continuity solutions to thousands of managed ...
Managing your data is about to get even better, with the addition of Datto in your BrightGauge! Datto offers comprehensive backup, recovery, and business continuity solutions to thousands of managed service providers worldwide, and we’re thrilled to make it easier than ever for our customers to access that data. Our Datto integration gives you the ability to seamlessly track your backups and manage the amount of data you are storing for your clients, in real time. Add that to your PSA, RMM, and QuickBooks data (plus tons of other sources), for a single view of all the metrics that help run your business - without the pain of logging into all those separate sources. Here are a few Datto metrics you need to know: One of our favorite gauges shows you how much of each device is in use, which could lead to a device upgrade, or at least alert your team that an agent needs to be moved: By default, Datto devices should check in automatically every so often, but if those devices are out of communication, how fast will your team know about it? If you’re utilizing our new gauge, it’s as simple as adding a color-changing threshold for an easy-to-spot update that will show on your dashboard in real time: We’ve also included a place for screenshot images, so backup monitoring and verification can be tracked right in your dashboard: See what our Datto customers are saying:

We sat down with Richard Trivedi, Owner of CadreNet, to talk about his business evolution after being the IT industry for over 20 years. As one of the first customers to use the BrightGauge + Tigerpaw integration, Richard knows a thing or two about making a business more efficient, but also how to increase MRR at the same time. How CadreNet Increased Operational Efficiency and Drove MRR with BrightGauge + Tigerpaw: Episode Highlights Richard’s Introduction & background (0:52) How CadreNet has found success with the majority of their work being remote (3:35) A day in the life as Owner of CadreNet (pre and post-BrightGauge) (4:35) How Richard became data-driven (6:39) Getting the team to buy into data (7:48) Manage to zero vs. watching numbers (9:15) Results with Tigerpaw + BrightGauge (10:47) The gauge that is key to Richard’s profitability by increasing MRR (11:09) Executive Summary Reports for Clients (14:11) Current priorities and focus for CadreNet (15:38) Learning how to be a better business owner and service provider (16:47) Focusing on a specific technology instead of a vertical (18:39) Advice from someone in the IT business for over 20 years (19:22) Parting thoughts and how to reach Richard (21:59) Want to find out more about The BrightGauge Podcast? Check out all the episodes here.
Up until the end of 2015 BrightGauge was primarily focused on operational and sales metrics. But as our customer base grew we saw a demand for more and more financial metrics. Some of them were in our customers’ PSA (Connectwise, Autotask, and TigerPaw) but we realized not all of it was. That’s why we decided to work on an integration with QuickBooks Desktop. With this change we have received a lot of questions and objections from our customers that we wanted to address: Objection #1 - Security Concerns About Financial Data Let me start out by saying that I believe operational data (customer name, phone number, location, service history, asset count, etc.) is more sensitive than how your team accounts for the revenue and expenses. That being said, we take security very seriously because it’s in our blood. Our sister company (and our oldest operating company in our family business) is an IT Security Provider, Compuquip Technologies. Both my brother and I came from Compuquip and continue to be involved with the business to this day. So security is always top of mind regardless of what type of data. You can learn more about our Current State of Security and also check out our Security Policies. Objection #2 - QuickBooks Reporting is handled by the Finance Team We can totally appreciate that each team has their areas of responsibility and understand that the finance team may want to keep QuickBooks data out of the hands of their operational team. That’s one of the reasons why we have built in User Permissions into our Advanced Plan allowing the administrators of the account to control who can see what information. For a complete list of the types of users we offer and the permissions please visit: BrightGauge Users Explained Objection #3 - What’s the benefit of real time financial reporting in BrightGauge? Do you have a real time pulse on your company’s financial performance? Or do you wait until several days after the end of the month and get a PDF report emailed to you from your finance team or bookkeeper with your P&L... when it’s too late to make adjustments to performance? Over 90% of businesses only review financials on a monthly basis with the most popular report being their Profit & Loss statement. The problem with waiting until month end is it might be too late to course correct your business, but by having the information earlier you can make the changes in real time based on the trends you’re seeing. Objection #4 - I don’t see why I need QuickBooks metrics We all know cash flow is the oxygen of any business and without it you cannot survive. Knowing it's this important, why wait for someone to run a report for you and send it to you each week or worse yet, each month. Why not have the information in real time being shared with all the key team members that can help collect. These types of metrics will impact your cash flow immediately and easily pay for the investment in the integration. Objection #5 - We already have a QuickBooks reporting solution and don't want to switch This one makes the most sense and we know how difficult it is to make a change to a new business intelligence tool or reporting tool. That’s why we pride ourselves in Crushing the Learning Curve but don’t take our word for it, hear it from a new customer that recently went through the experience: Priority One Makes the Change to BrightGauge. Financial data brings a unique context into your organization so when you combine it with Operational data the result is true, valuable insights into the overall health of your business. See how having the right reports and dashboards at your fingertips can help you achieve your business goals:

Key Performance Indicators seem to be the center of attention in the SMB world, and for good reason. The idea is that by tracking the numbers that matter most to your business, you’ll be able to determine what’s working well for your operations and more importantly, fix those areas that are not working well. It sounds easy enough in concept, but we hear regularly from people who tell us they are tracking KPIs but still haven’t seen much improvement to their business operations. To which our next question is “how often are you tracking your KPIs?” Plenty of SMB leaders today are still trying to run their business on the old, monthly P&L statements and struggling to make effective calls that will aid their business as needed. When we get some of these leaders on a call to talk about how they can better manage their data to get the results that they want, our first order of business is to explain why it’s critical to constantly track KPIs. Sure, there are some that can be tracked daily or weekly, but if you can track KPIs throughout the day, it’s so much easier to see when a particular number starts to slip and that means you can get started immediately on a fix. No need to wait until days or weeks later when the issue has no doubt started to snowball into a fix that will take more time and effort to amend. On a similar note, our friends at ChannelE2E recently shared some stats about best-performing SMBs and why they have made the decision to monitor KPIs in real time: 50% of companies that track metrics in real-time met all their goals in the last 12 months compared to only 24% of companies that did not track in real-time. 92% of companies that tracked their metrics in real-time met some or all their goals in the last 12 months – compared to 64% of companies that did not track in real-time. But here’s the most telling stat of all: Only 14 percent of SMBs are monitoring their KPIs in real-time. Now here’s some food for thought: if you know where your business operations stand with your current method of checking KPIs sporadically, why not increase your tracking and monitor the results you see? In a worst-case scenario, you’ll see small improvements by keeping a more vigilant tab on your metrics, although we’re willing to bet that there are significant achievements waiting for you once you take the right steps! Ready to learn more about the 6 key areas that all companies should track in order to monitor the health of their business? Download our free guide to KPI Best Practices:

When it comes to finding the perfect balance between keeping your MSP business running efficiently, and also making sure your customers are happy, it’s easy to feel like you’re running in circles. It can be a hard goal to accomplish. That’s why we’re so excited to introduce our next customer-led webinar on Service Management Best Practices with Nick Olerud, Director of Technology at Netrix IT. Nick will join us on Wednesday, 1st June, 2016, to share some of the dashboards and management techniques that helped his team improve and now maintain their best-in-class performance. Some of the topics Nick will cover: how to hold your team accountable with metrics and scorecards how he uses dashboards to manage projects and ensure his team is delivering on time using dashboards to manage escalation tickets leveraging BrightGauge to provide transparency to customers via dashboards and so much more! Save your seat now for our next dashboard tour! Everyone who RSVPs will also receive the webinar recording so you can go back and reference at any time:

70+ Metrics for MSPs
Key metrics and accompanying formulas to help MSPs skyrocket growth and success!
Get your KPIs

Running an MSP (or any SMB for that matter) can sometimes feel like a juggling act. You’ve got clients to keep satisfied, team members who need guidance on their day-to-day responsibilities, metrics to track, decisions to make, and probably a hundred other things going on simultaneously. We know, we’ve been there too. In the middle of the madness, one of the things that seems to snowball from a small effort into an avalanche of updates is trying to keep up with all of the SaaS products you have in use. From managing a master list of all the products in your collection, tracking which product is being used by which team member, who needs to be onboarded, or who needs to be offboarded, you can quickly find yourself in a mess of records. Luckily, there’s a really simple solution to manage your SaaS products by using a dashboard. Utilizing Dropbox to Manage your Subscriptions One of our cool features that sometimes seems under-utilized by our community is the Dropbox integration we offer. While it’s easy for people to overlook initially, the Dropbox feature is a great option to have when it comes to data sources that are not native integrations at this time. So whether we’re talking about tracking SaaS products, managing your phone system data, analyzing customer survey results, or anything else, Dropbox can easily be a key player in achieving a well-rounded business intelligence view. Besides giving users a ton of versatility when it comes to the data they monitor, our Dropbox integration is also incredibly easy to use. By leveraging a simple CSV file, you can quickly get the data you need displayed on your dashboard. You’ll first get started by connecting Dropbox to your BrightGauge (see the step-by-step instructions here). Once you have that completed, then you can get to work on creating a dataset from your CSV (see instructions here). We've even created a SaaS Management Template so that you can get started now! Thinking outside the business lines with Dropbox On another note, our Dropbox integration isn't just for operational numbers; we have also used it to put together some fun dashboards, like the one that tracks our love for coffee, a Fitbit dashboard, or even Brian’s wine inventory. The possibilities are endless with Dropbox + BrightGauge… so tell us, how will you use the integration?
Just when you were considering how many more screens would be necessary to showcase all your best metrics, the team at BrightGauge saves the day with an exciting new update! With our new rotating dashboards feature, you can now keep as many gauges as you need in sight. No more trying to squeeze as much as possible into one display… give your data the space it needs to shine! Currently, the interval / timer is set to rotate a dashboard every 2 minutes and the next dashboard will fade in when it’s time. Plus, you can always pause the rotation if you would like to stay on a dashboard for a while and you can skip ahead to another dashboard from the dropdown list in TV mode. Here’s how rotating dashboards work: When viewing a dashboard and clicking on the TV button on the top right, you are now presented the option to select a single dashboard (the one you are on) or to rotate dashboards. If you select rotate dashboards, a modal comes up with the option to choose a playlist to play or to configure a playlists. There are three playlists and each one is private to your user account so not to worry, customize away! You can drag dashboards over from your list on the left and re-order as you please on the right. The playlists are saved when you press “Save & Present” or “Present” so you can reuse them over and over again. (get all the details here) Now, get to rotating some of your favorite dashboards and let us know what you think about this new feature!
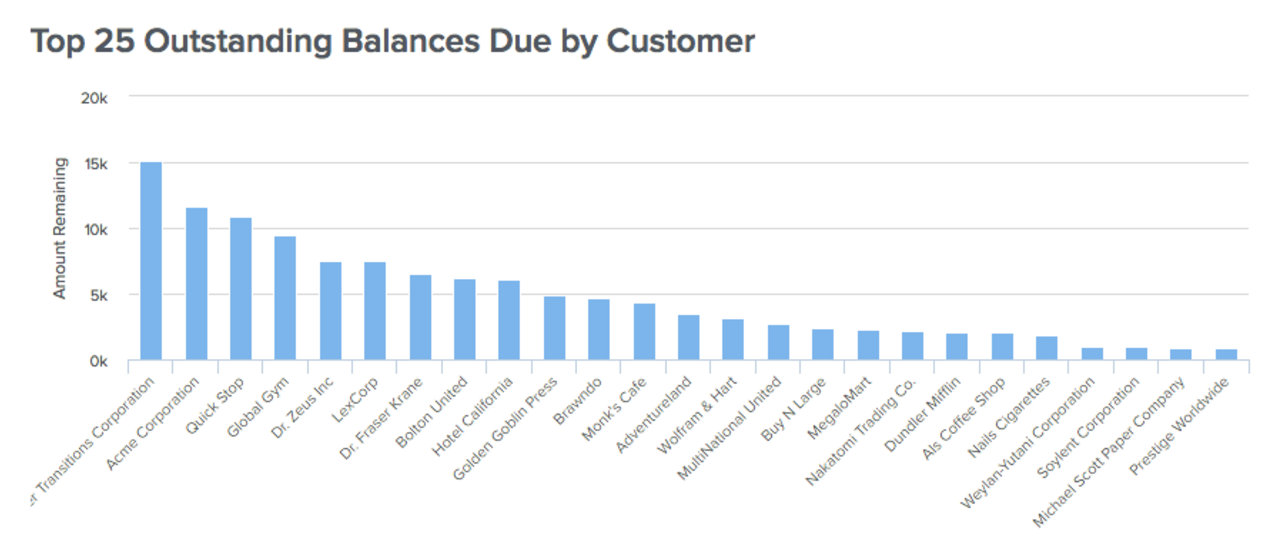
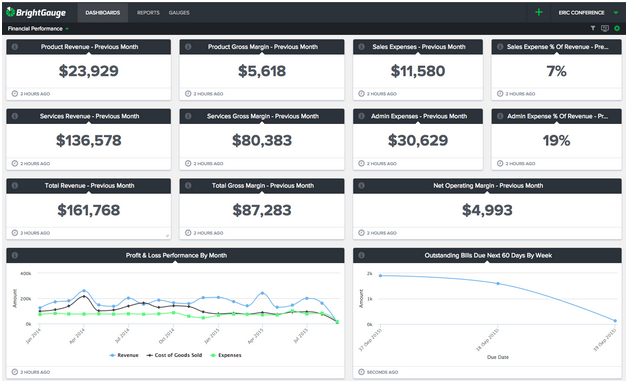
If you are like most IT Service Providers you rely on your monthly Profit & Loss Statements (P&L) to do a deep dive into your financials but P&Ls are usually delivered a few days after month end. The problem with this approach is the potential negative impact to your cash flow from having too many invoices outstanding. But rather than having to wait until the end of the month you can now have access to these key metrics in real time. Here are a few of our most popular gauges relating to Accounts Receivables and how you can leverage them within your business. A simple visual like the one above gives you a quick snapshot into which customers have the largest outstanding balances across your entire customer base. Typically your largest customers have the largest outstanding balance, however, by understanding the total amount and how it compares to others is important to make sure it’s not over weighted to any one particular customer. And when you target your invoice collection follow up you can start with the ones that will make the biggest impact. See how easy it is to keep Accounts Receivable data at your fingertips Another popular view for Accounts Receivable is to break them up by amount of time past due to see which customers are the biggest violators of your terms. The goal should be to keep as much as possible current, meaning they are still within their terms of payment. However, just about any business will still have a lagging payment here and there and using an Aging Detail report will allow you to quickly spot any problem customers that might have slipped and are now past due. Now that you know which customers are past due and what their balances are, it’s easy to follow up with your customers to get paid. With our Outstanding Invoices Details you can quickly see each individual invoice that’s outstanding and all the necessary details about each to properly follow up. Cash is the oxygen of any business and understanding where your outstanding balances are is a critical metric to track on a regular basis. Remember that “regular basis” doesn’t mean waiting until the end of the month because then it might be too late to make the changes that will impact your bottom line. Instead, by leveraging our QuickBooks Desktop integration you’re able to see this information in real time and deliver to the appropriate team member to follow up.
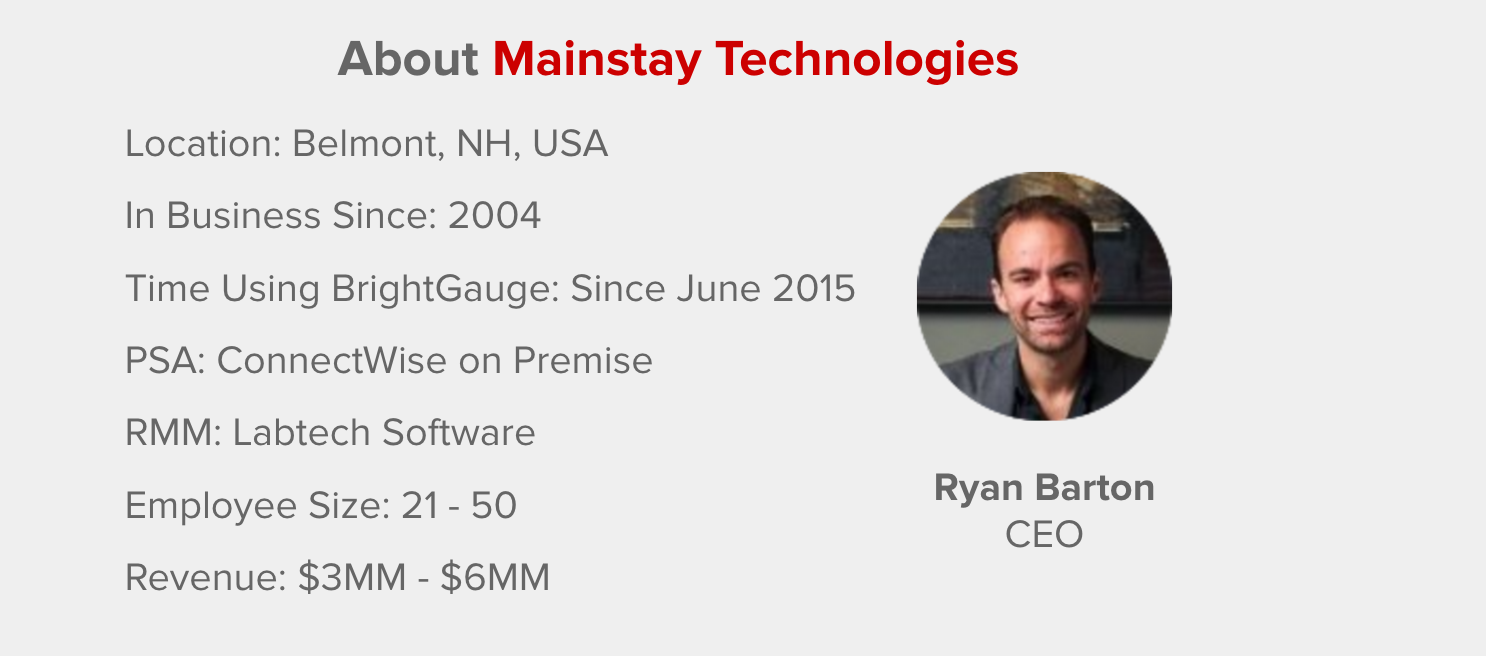
[Case Study] In days past, the team at Mainstay Technologies had no Business Intelligence solution. They utilized reports available in their ConnectWise and LabTech, or built SQL reports from time to time, but the process was slow and didn’t always look good enough to share with clients. Mainstay CEO, Ryan Barton, knew that visualizing data, understanding it and the things related to it would be the key to best govern the actions necessary for the growing IT Services company. But he was also frustrated that his team didn’t have enough visibility from their PSA and RMM data, because that’s where 98% of their business is. The more he studied the correlation between good data and good judgement in business, the more Ryan knew it would be difficult to grow and have a good sense of where they are if the team didn’t have a handle on their data. There were times when a huge problem was looming for months but since the team lacked the necessary insights, nobody realized the issue until it was too late - like the time patches weren’t installing properly for months on end. Adopting BrightGauge When he started looking for a customizable BI solution, Ryan demoed several different solutions priced at tens of thousands of dollars per year, plus extensive time would be necessary to get any of the products working specifically for a MSP. That’s when it dawned on him that what Mainstay really needed was a tool that really understands the MSP industry and had the defaults and templates built out already. As Ryan explains, “if you put a red slice of pie on the tv on the wall, it’s going to drive action in a way that talking about it never will”. Once Ryan made the decision to join the BrightGauge community, each area of the business was able to identify and implement the best solution that would help them properly track their KPIs, whether it was dashboards, internal or external reporting. For example, in Centralized Services, they use dashboards and are constantly watching what updates and antivirus are doing. When it comes to clients, reporting is a big value add. Mainstay focuses on 2 primary reports. First, there’s a client-facing one that drives conversation and shows the value and visibility into what they are doing. Ryan emphasizes that it’s exciting for his team to hear feedback from operationally-astute customers because those organizations immediately see the Business Intelligence that Mainstay is leveraging, and it gives them a great competitive edge. Second, there’s an internal report that tracks ticket trends, feedback scores, response times, infrastructure health, aging summaries (over 5 years, expired warranties, etc.) and even financial profitability. The ability to sit with the team and do a quick planning session is now almost effortless because the data is right in front of them. As for the impact his BrightGauge has on asset management, Ryan explains that because Mainstay has a defined minimum standard for service delivery and can keep clients at that point, the result is noticeably less stress within the team. With a more standardized setup, the team has become far more efficient at delivering service and driving more projects when gaps are identified. The result is more problems solved, increased revenue, more efficiency, higher team satisfaction, and of course even more client satisfaction (you remember... the well-known sentiment that happy employees equal happy customers!) Results with BrightGauge Since their BrightGauge integration, Mainstay now has more visibility and command over centralized services than they ever had before. Plus, with their new ability to put specific processes and operations in place, Ryan and his team have more confidence in their data because it can now be put into an actionable format. By utilizing BrightGauge for their Business Intelligence solution, Mainstay has “transformed from being at the industry standard install rate of about 95%, to now about 99% because we have the exact visibility into when updates were last installed and on which machines, how many are missing, and when they were last rebooted. We can see it, customize it, and immediately get answers to questions”. While the team started with BrightGauge in Centralized Services, Ryan was quick to realize the potential at hand for other areas of the business that could be positively impacted with more visibility. In no time, the team was leveraging data to track infrastructure health, service management for stale tickets, project management, client management, individual accountability, uptime, system health, and more. When those areas were up and running, Mainstay decided BrightGauge could help with staffing and capacity decisions, track who’s solving which tickets and the different types of tickets, trend analysis, and the number of tickets as compared to the number of hours and response times. Ryan sums it up best when he explains “having visibility into our data with access to the kinds of customization that makes it accurate and in a meaningful format, actually drives action”. Recommending BrightGauge For MSPs who are just getting started on their data journey, Ryan offers a bit of advice: “start with one challenge that you know good data will help to solve and if you can just focus on that one thing and rally around it, then you will start to see results instead of doing 40% on several different projects. Most companies get caught by the gaps they didn’t even know were there. Good data allows you to be proactive rather than reactive."
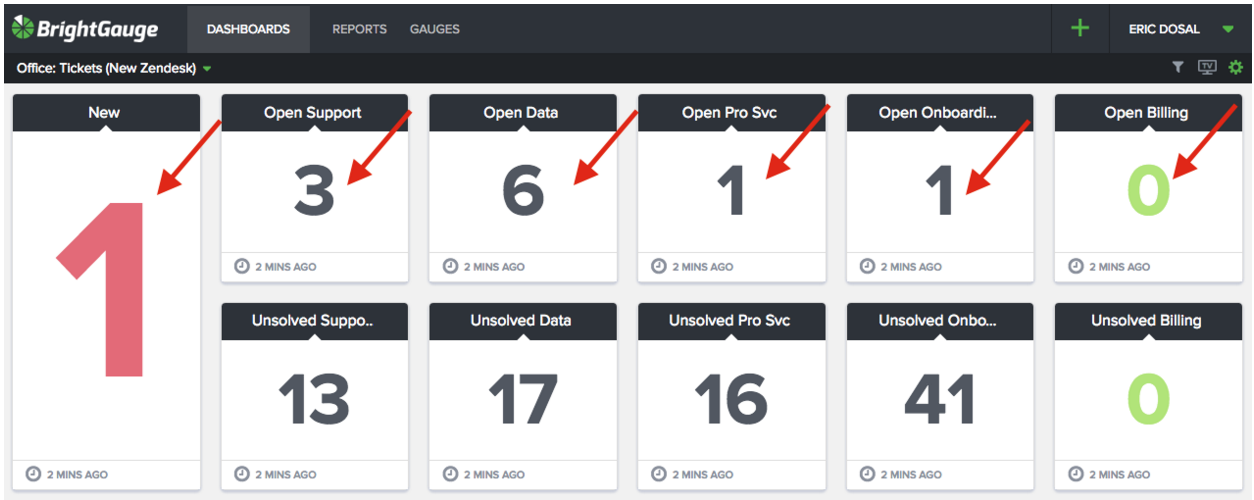
One of my favorite teams at BrightGauge is our Customer Success Team. We have 3 awesome fellas on the team (and looking to hire 1 more if you know of anyone) which is lead by our Customer Success Manager, Randall Berg. The team does a great job making sure our customers get onboarded once they sign up, receive the proper training, offer any assistance with customization they might need and of course address any support related questions that come up during the process. With the functions of the team easily divided, we then started tracking how many open requests each function had. As you can see from the screenshot below we break out the tickets received by group and then our goal is to keep the “Open” count at zero. This allows us to “Manage by Exception” or “Manage to Zero” making it very easy for everyone to see how we’re doing. This dashboard has 2 goals which are “No Red” and “Get to Zero”. No Red - Using our colors and threshold features, we have assigned certain benchmarks for our numbers that indicate a problem. In the example above, the “New Tickets” is in red because we never want to have any tickets in New status that we haven’t responded to. Additionally, we have other thresholds for Open tickets. For example, if there are 10 open support tickets the number turns red. This makes it very easy to identify problem areas that need to be addressed quickly. Get to Zero - The second goal is to ensure that all the numbers in the top row (our Open Tickets for each group) are at zero, meaning the next step is waiting on the customer and not us. Once they are at zero the color turns green (using our colors and thresholds) as you can see on the right in the Billing group. While it’s so easy to make gauges and keep track of many different metrics on the Customer Success dashboard, we have to ensure that our team can easily get a snapshot of their performance throughout each day. By implementing two simple rules, “No Red” and “Get to Zero”, it makes for an effortless solution to keep everyone on the same page and accomplishing the right task at the right time.
If you read the title of our latest episode, you may be wondering why a software company would be asking for advice from a real estate company, but the answer is simple. At BrightGauge, we often hear questions from our community asking for advice on building, managing, and growing sales teams… and almost everyone faces the same challenges no matter what line of business they’re in. We asked Gabe Martin to join us for a conversation based on his experience as Sales Manager for one of the highest-ranking residential real estate sales teams in the United States. Gabe has the answers to all the questions we hear so often: from recruiting based on personality types, to managing the day to day and weekly responsibilities, focusing the team’s efforts and much more. So whether you’re running a MSP or any other business, you’ll be able to gain some new insights and ideas about your own sales team. How to Find, Manage & Monitor a Sales Dream Team: Episode Highlights Gabe’s introduction and background (1:08) Why we invited a real-estate person to join our podcast (3:46) Gabe’s approach to the hiring process for sales people (4:33) The DISC personality profile (5:52) Next steps for personality matches (9:04) The best way to get a feel for who an interviewee really is (11:42) The numbers behind interviewing and hiring sales people (12:49) Managing the team day-to-day (13:47) The number of dials and contact rate in a 3-hour period (16:12) One-on-one meeting agenda (17:30) Remediation for team members who fall off track (23:47) Metrics Gabe tracks (24:51) Driving team competition (26:52) How to promote team bonding and camaraderie (29:27) The best business book and podcasts Gabe recommends (31:20) Resources that Gabe uses to get better every day (34:50) Parting advice for SMBs (36:20) As referenced in the episode: The Miracle Morning: The Not-So-Obvious Secret Guaranteed to Transform Your Life by Hal Elrod Want to find out more about The BrightGauge Podcast? Check out all the episodes here.


