Blog Logo-2.svg

The BrightGauge Blog

Why Visualization Matters when Making Sense of Data

So much data, so little time. You hear about it a lot lately, in business publications, social media, maybe even in some of your company meetings... but what is data visualization, and why are so ...
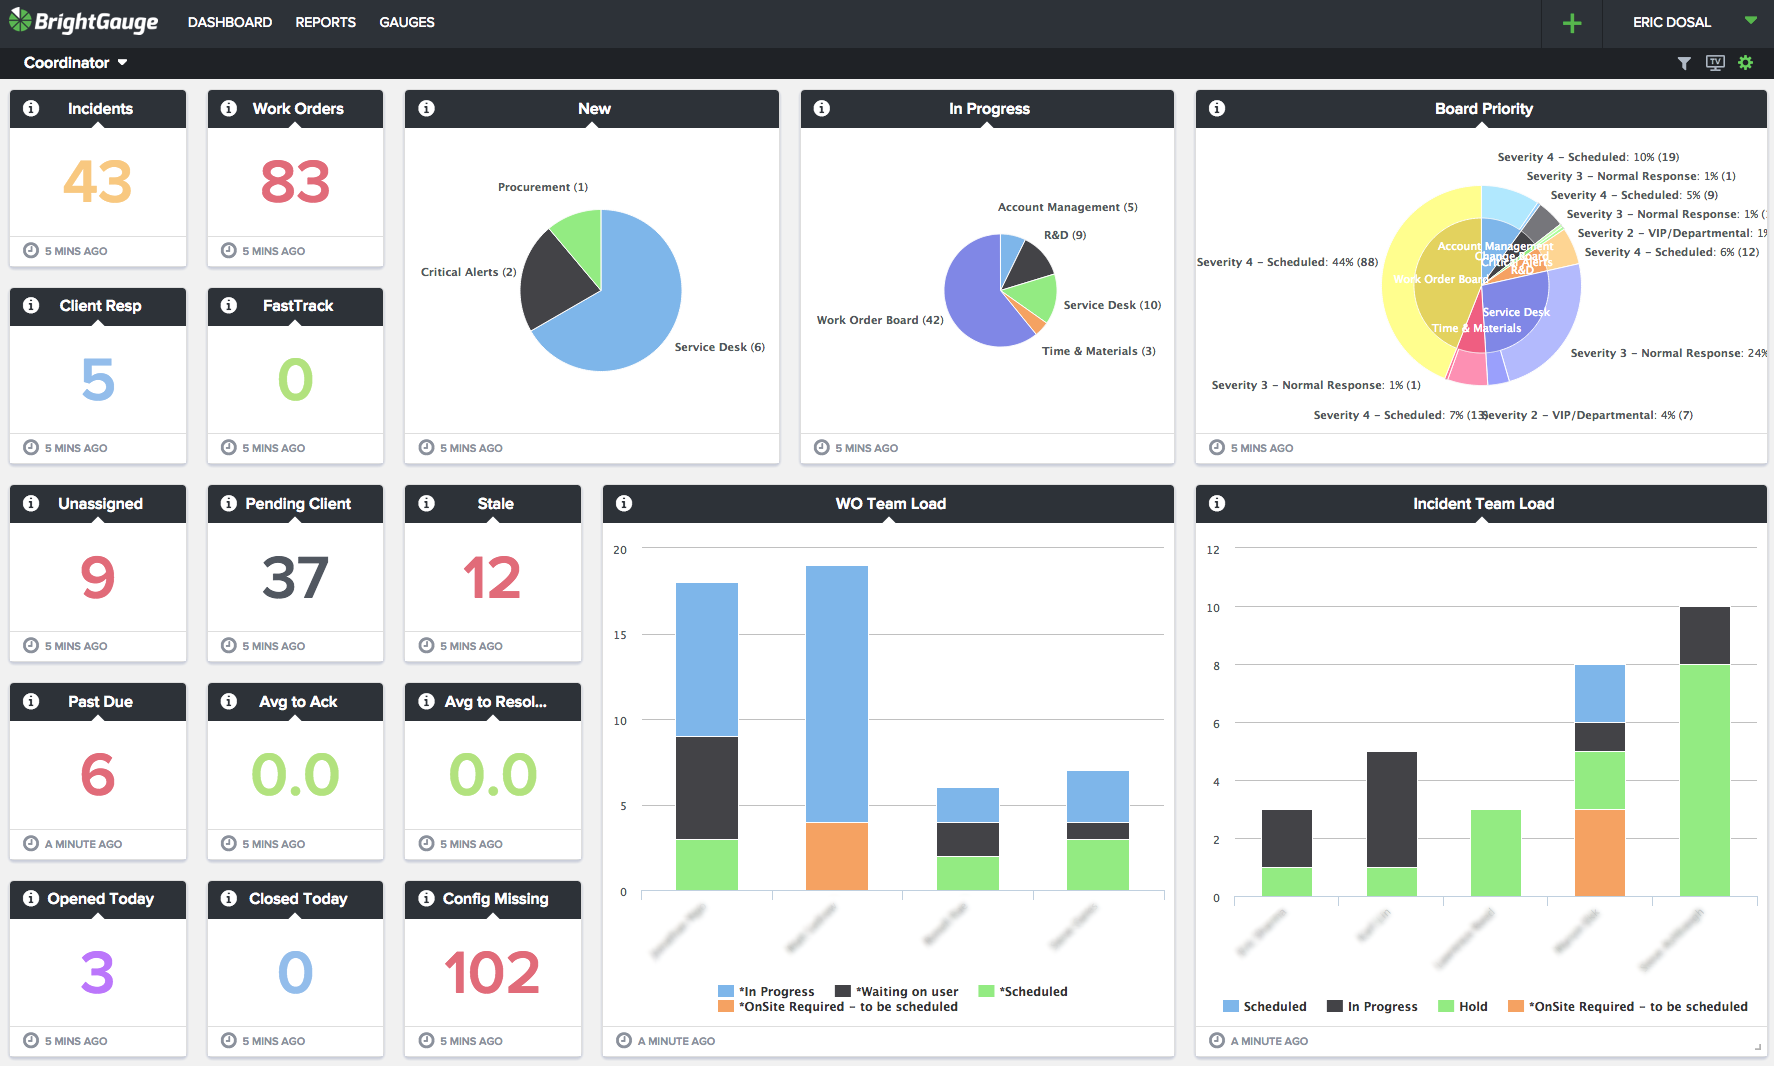
So much data, so little time. You hear about it a lot lately, in business publications, social media, maybe even in some of your company meetings... but what is data visualization, and why are so many companies now looking to jump on board with a visual solution? Businesses today are moving faster than ever, and running any successful company means making decisions that will best benefit the business in the long term. Hopefully those decisions are made using data instead of gut feelings, but data can present a problem of its own. Most companies have tons of data at their fingertips and running reports is not only time consuming, but it can also be overwhelming to compare trends in the data at hand. Take my own recent experience digging through a pile of information that I needed to sort quickly. I was working on some new marketing content with our CEO, Eric, when the conversation turned to the best channel we should use to reach our community. He asked me to pull the stats to show our most popular avenues - email, podcast, social media, etc. You may think this would be an easy task, considering we’re a data company and all, but like so many of you have probably experienced I hit the wall of what we call a data silo. Our marketing platform, HubSpot, unfortunately doesn’t offer much in the way of charts and dashboards (although we still love their product). So there I was, creating a list, exporting the data to CSV, and then importing the CSV into a spreadsheet so that I could make a nice pie chart to share with Eric. What a pain! Fortunately for me this time, I was only pulling the data behind one topic, or else this project could have taken ages. Why do visuals even matter? After the nightmare of all the shuffling from one software to another, it would be easy to lose sight of why making that pie chart was so important in the first place. Using graphic images or charts to present data isn’t just about a sweet-looking way to decorate your walls and represent numbers. It’s also the best way for a human brain to analyze and comprehend the numbers as seen before it. By placing data in a graphical form, the end user can easily understand the significance of the data before them, compare multiple pieces of data or even set goals and objectives based on the data. In fact, here are a few stats to help us explain just how important visuals are when it comes to interpreting data: The human brain can process entire images that the eye sees for as little as 13 milliseconds (source: MIT neuroscientists) About 80% of the information we take in is by eye (source: TED study on Visualizing Data) The human brain processes visuals 60,000 times faster than words (source: Dr. Lynell Burmark) But that’s not all. Data visualization is not only the fastest way to show data, it’s also a key factor in the impact and recollection factor. According to Forrester research, “When we hear a piece of information, we remember 10% of it three days later; if we add a picture, we remember 65% of it.” Now that’s a stat worth remembering! visualizing Service Coordinator results in dashboard form is the easiest and fastest way to comprehend the data When it comes to the best way that you can manage and grow your business, start by making sense of your data. Use a visual solution to translate trends into business intelligence that’s easy to understand, and if you have questions about how to better manage your data, reach out to our team to learn more.
request-a-brightgauge-demo

3 Insights Every Service Manager Needs to Know

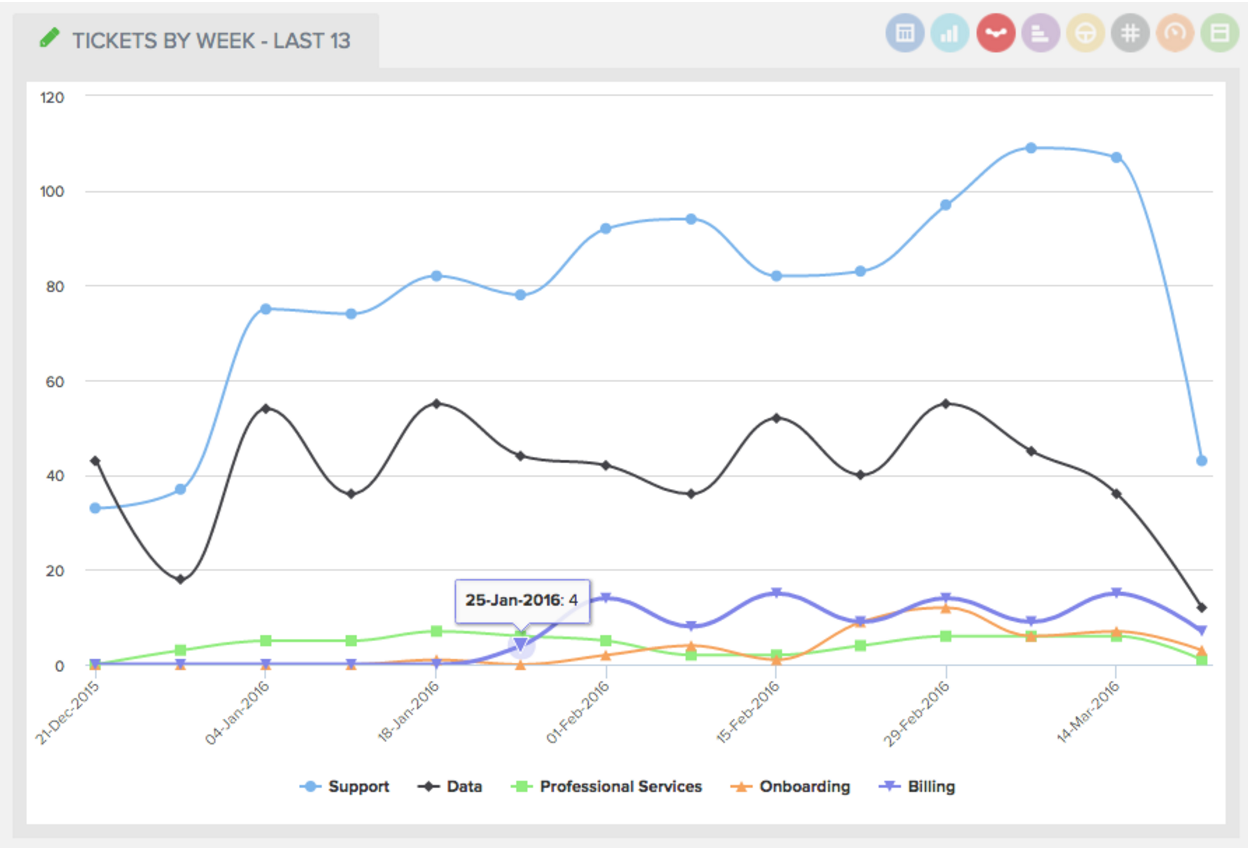
We love data and our customers love data, but data is just a part of the story when looking at a data-driven lifestyle. From the data, we need to gather insights because insights make us aware of what areas of our business we need to better manage and focus on. Here are a few insights your Service Manager can glean from the right metrics showing the right data... How busy is my team? This trending line graph allows you to visually determine whether your team is experiencing a spike in volume or whether activity is within your normal range. By having this metric handy you can quickly and easily make changes to your team and staff up as necessary. How busy are each of my team members? With a simple scan of our bar chart of “Currently Open Tickets by Member” you can quickly see at a glance how busy each team member is. More importantly, you also see how busy they are in relation to one another which gives you an opportunity to move work from one member to another. How efficient are my team members? With a bar graph similar to Currently Open Tickets by Member, this gauge shows which of your team members are closing the most tickets. If a team member is following behind others it might signal a coaching opportunity is needed or perhaps they need to be better trained. While the fast-paced world of MSPs revolve around so much data, make sure that you’re focusing first on the metrics that will make the biggest impact for your business. To learn more about how to identify the ‘right’ metrics that will ensure your success, download our free whitepaper.

Subscribe to get the latest content delivered to your inbox

Customer Best Practices [Free Webinar Download]

Do you ever wonder what everyone else is doing with their data? How they're leveraging it to help grow their business and keep their customers happy at the same time? Everyone loves a little dashboard inspiration, especially if it comes from a Power User. That's why we asked Shann Bosnell, VP of Technology at TUC Managed IT Solutions to lead a Show & Tell webinar with our community. He shared all the Best Practices his team uses every day to help manage the business. Topics covered during Shann’s presentation: How TUC uses data for their ITSM team Real-life examples of dashboards used by TUC's Sales Team The custom gauges that help TUC uncover sales opportunities across their client base and so much more! Shann’s BrightGauge tour is available on demand by clicking the image below:

Power User Best Practices: A How-To Tour for Managing Sales

Are you making the most out of the data at your fingertips? If you’re like most of our customers around the globe, then maybe you’ve caught yourself wondering what everyone else is doing with their BrightGauge. After all, viewing someone else’s work is sometimes the best way to inspire yourself to think outside the box when it comes to your own projects. Learn how to model the masters With this idea in mind, plus plenty of you asking to share ideas within the community we’re thrilled to share our first webinar that was hosted by a BrightGauge power user! Shann Bosnell, VP of Technology at TUC Managed IT Solutions joined us recently as he led a show and tell of sorts filled with custom gauges, dashboards, and insights on all the best practices you need to know. The webinar was originally a live event, but you can still access the full recording using the link below. Some of the topics Shann covered: Learn how TUC uses data for their ITSM team See real-life examples of dashboards used by TUC’s Sales Team Walk through some of the custom gauges that help TUC uncover sales opportunities across their client base and so much more! Access the webinar recording here:

The 3 Keys to Stand-up Meetings for Better Team Communication

There’s a lot of excitement when it comes to being part of a team that’s rapidly growing. There are new skills brought to the group, new personalities added to the mix, and you see accomplishments stacking up faster than ever. But growth comes with some challenges also, and over the last year our team has been right in the middle of the excitement and the obstacles. A year is a relatively short amount of time for a team to almost double in size, and one of the big differences for our group was trying to keep up with effective communication. Yes, we talk to each other constantly as a result of a very open floor plan in our office, plus we have lunch together most days, and there are always Slack messages being traded. While those are all great ways to have a quick chat, we still needed a way to make sure that within the Growth team every individual stays up to date on all of the pieces that make up the larger puzzle, so to speak. One of the best ways we’ve found to keep everyone in the loop are weekly stand-up meetings. Every Monday morning, our team gathers in a circle to share a quick (15-20 minute) update about everything going on in Marketing, Sales, Customer Success, Data Customization, Support, and an Executive update as well. Eric leads a stand-up discussion on analytics How to host stand-ups First things first: we’re serious about keeping these sessions at a minimal amount of time so that we’re finding the right balance between increasing communication without taking away from our productivity. To help ensure that the session stays quick, each team member is required to update their notes on a shared Google Doc prior to the start of the meeting. This way, we breeze through and nobody has to stop and think about what they need to say. There are 3 topics that make for a successful stand-up: Recap of accomplishments the prior week: The key here is to highlight a few tasks that are not part of your regular weekly routine. For example, as Marketing Coordinator I wouldn’t tell the rest of the Growth Team that I completed a few blogs during the week because that’s a given. I could instead talk about the changes made to an email layout that increased click through rate by X% because it’s a special project, plus measurables are always a great thing to share when possible. Focus for this week: Again, make sure the plans you talk about for this week are not part of your ongoing weekly functions. This is your opportunity to reference some of the special work you’re focusing on that will be a step towards completing a big picture project. Obstacles that are impeding progress (especially ones that may need team help to conquer): Some weeks you’ll find that you don’t have any obstacles to mention, and that’s fine. However, let’s say I’m working on a blog that needs some data from a specific gauge and the data doesn’t appear to be correct. I would mention this during stand-up time because it gives a heads up to the Data Customization team that I’ll need a few minutes of their time to get the data sorted before I can finish my task. a sample of the topics covered at a recent standup If your team is in need of a fresh take on keeping everyone in the loop, give stand-ups a try. We really enjoy the opportunity to have a quick group discussion on the big picture items and also understand what our counterparts are working on each week. Plus, if you find that you need updates more often, take a page from our Product Team’s playbook... they host a standup every morning!

70+ Metrics for MSPs

Key metrics and accompanying formulas to help MSPs skyrocket growth and success!

Get your KPIs

PriorityOne Reveals What to Expect when Adopting BrightGauge

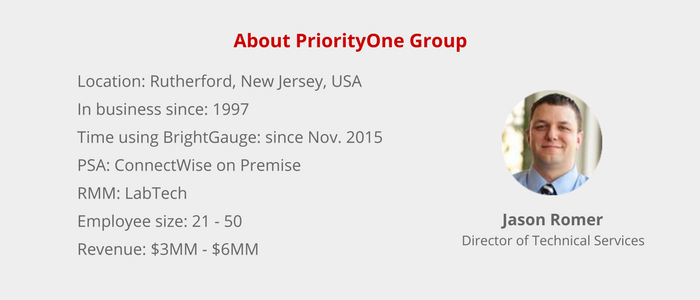
[Case Study] Sometimes in life, you don’t initially realize when things could be even better than they already are. At first glance, the grass is green on your side of the fence. The team at PriorityOne Group used to be in this scenario… their grass was green when it came to the dashboard and reporting solution they had in place and they actually liked the product very much. But at a closer glance, there were some brown patches to be found here and there. As Jason Romer, Director of Technical Services, looks back on his days of using that first software solution he remembers that he wished for faster support response times and more guidance on what the software could do. Additionally, the gauges and dashboards in those days were very time intensive to manipulate - and with a growing business he didn’t have any time to spare. The Change It was the IT Nation conference in November 2015 that gave Jason a glimpse into how green the grass could be for PriorityOne. He had just left the booth of his dashboard solution at that time, when he came across the BrightGauge booth. As he tells the story, “I spoke to the BrightGauge team and they showed me the types of gauges and reports they had. The a-ha moment was when they said they would set it up for us and showed us the Quickbooks datasets – as soon as we saw that, it was a wrap.” Besides the Quickbooks integration, Jason was also keen on the ease of use and data manipulation that he knew would result in rich reports for his clients. But it was the BrightGauge team that truly sealed the deal. Jason concludes that “the people sell the product” and we certainly agree that our people are one of our best assets! Getting Started with BrightGauge Looking at the BrightGauge implementation and onboarding process, Jason states that it was “incredibly easy”. It all started with a Data Customization chat with our team so that he could explain what PriorityOne wanted and the parameters of how they use their data sources. Jason goes on to explain that the onboarding process and the people at BrightGauge are the most positive experiences in his time as a customer. “We were hand-held from the beginning, which from my point of view trying to run a MSP of our size and not having the time to get into the weeds on all this stuff is HUGE! The BrightGauge team did and is still doing the work for us so that we can focus on using the tools.” When it comes to the software differences Jason confides “there are many positive differences just in terms of user experience, look and feel, types of data that is available and the reporting aspect, but it’s the people that make BrightGauge different and stand out. Even when the team got slammed with work around the holidays, they were upfront about it, setting expectations with me the entire way. It was a breath of fresh air in a world where everyone seems unable to tell the client what’s really going on.” Recommending BrightGauge The effect of changing their Business Intelligence platform showed quickly for the team at PriorityOne, as they were soon able to benefit from the results of leveraging BrightGauge. Jason explains that now he and his team “see everything” from A/R at a glance or even noticing when their engineers are getting too busy… and that visibility also allows them to work on other aspects of their business. Jason minces no words as he explains to the MSP community “If you don’t have a dashboard system you have no idea what you are missing, seriously, because you have no visibility on what you are missing. I recommend BrightGauge over other solutions because of the hands on approach the staff takes, the elegance of the dashboards, the ease of use and manipulation, and the quality of the reports.”

Revolutionizing Support with Video Clips

It’s probably safe to say that throughout history, plenty of great ideas, inventions, and achievements were stumbled upon rather than being planned out. Sure, a lot of people may also be chasing a dream and have a specific route in mind along with a checklist to get them there. In this specific case, the Support Team at BrightGauge found themselves in the former category when it came to ramping up their efforts on customized videos almost a year ago. Our team had dabbled in support videos here and there, but prior to a year ago they were occasional at best - usually saved for a really complicated ticket that couldn’t be explained by a written response. Then Kristian joined our growing crew. As the main Support guru on our team, we left Kristian with the responsibility of making sure our support time continued to be world-class and that our customers were happy with the help we provide. We didn’t really set many guidelines about how he should achieve that task… this was his project to own. Kristian was up and running in no time, and hearing him recording quick videos became a common practice. As the months flew by and the videos kept multiplying, the happy customer responses just kept rolling in. In fact, we have a Slack channel dedicated to sharing Customer Feedback, and after a while we knew we had definitely written a new chapter in the BrightGauge history book. as shared in Slack: a note from a customer in Victoria, British Columbia, Canada When we asked Kristian about how the videos came to be such a big focus for him, the answer was simple: “I personally am a visual learner and I believe most other people are too. So if I have the ability to show someone how to do something, I’ll take that route. I also think it’s not only easier for me to record a quick video vs. typing a long explanation, but I think it’s also easier for the customer to watch a short video.” Like the example above, if you’ve had the pleasure of receiving a customized support video clip from Kristian or anyone else on our team, then there’s a huge chance that you were incredibly excited about it, probably sent us a love note, and also wanted to know more about how you could implement the same idea on your team: another example of the great notes we’ve received about our support videos We’re always excited to give our customers the answer when they ask, but since there are plenty of other companies out there who could benefit from better service and support we decided to share our secret with the world - Droplr is the tool behind our customized video success. (side note: Droplr does more than just videos and our team uses it in some manner every day at BrightGauge HQ.) The custom videos have become such a key part of our support method that we now ask job candidates to send us “how to” recordings as part of the interview process for our Customer Support Specialist opening! Videos are here to stay and since seeing is believing, here’s a sample video recently sent to a BrightGauge customer: When you give customized videos a shot, please share your experience with us... we think you'll love it!

How Origin Manages Data Across Their Organization with BrightGauge

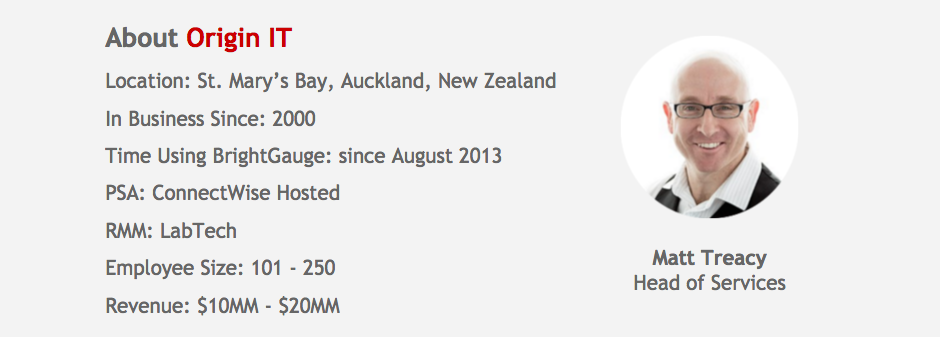
[Case Study] In a time when measurables mean everything to a rapidly-growing business, the team at Origin IT found themselves looking for a more comprehensive data solution. Back in 2013, they were using one dashboard solution in their service area and for all the other areas of their business they were extracting data directly from SQL which was a manual process. While they managed to make the most out of wrangling their data sources, what they were originally looking for at that time were good-looking, external, client-facing reports. Adopting BrightGauge When Origin first launched BrightGauge as their data solution, they had an employee base of about 45 people and kept their focus solely on client reporting for a short time. However, the Executive team at Origin realized that rapid growth opportunities were on the horizon and they needed to assign a team member to focus the majority of their energy on managing data across their entire business. As Head of Services, Matt Treacy, explains he “didn’t have the time or knowledge with SQL” that would drive the type of customization the business was looking for. The team found their solution in hiring an Operations Analyst, Georgia Anderson, for the growing MSP. As Matt explains, the adoption process was a quick one for the large team because they instantly realized how much was possible with BrightGauge, how quickly Georgia could pull it all together, and how their data ended up in a neat presentation using both reports and dashboards. The Results: How 7 Key Business Areas Incorporated Dashboards to Help Drive Their Success In the last 3 years since becoming a BrightGauge customer, Origin IT has grown from 45 people to 125, and Matt tells us that they leveraged their data to support their massive growth because “data drives each department to understand what’s going on in their area”. Plus, the availability of data has opened the floodgates to wanting even more information at their fingertips. While the partnership began with a focus on pulling ConnectWise data for external reports, they now have automated reports and custom dashboards for individuals, teams, the management team and even their board of directors. Finance: Where Origin previously had a custom SQL report with daily financials, there is now a live dashboard to show financials from across the business. Sales: This group keeps an eye on the near future using an automated monthly rolling forecast based on new opportunities and probability of closure. Service: For this team, additional data sources such as the phone system are imported via Dropbox to ensure that reports and dashboards reflect a true 360-degree view of Origin’s business operations. Projects: For Project teams, there are daily updates on the amount being billed, the amount outstanding, and more. Account Managers: In this group, each person has their own personal dashboards that show their sales activity, as well as dashboards for specific clients. Customer Satisfaction: CSAT scores also end up on the big-screen TVs found in nearly every room of Origin’s spacious new office. The Board: When the time comes for Board meetings, dashboards are leveraged again to quickly and easily show the data that used to require a more time consuming process involving SQL and Excel spreadsheets. As Georgia explains, the beauty of creating all of these custom reports and dashboards is the time savings she sees: “once they are created, they are set for good”. Recommending BrightGauge As Matt tells us, “looking back about 8 months ago, when the owner of the business asked us for a report, it would take a week or two to create. Now it’s done by the end of the day or the next morning. Everyone knows they can ask for anything now. Before it was ‘no, can’t do that’. The process is now streamlined and easy.”

How Netrix Drives Improved Team Performance using BrightGauge

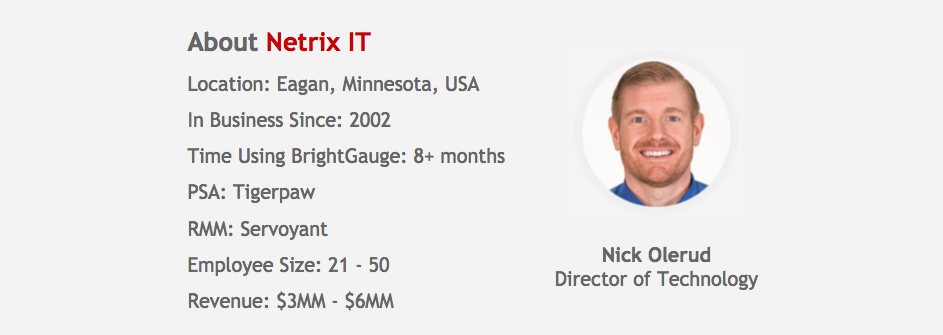
[Case Study] Netrix IT runs on Traction EOS and this business model requires a scorecard to be reported on weekly from each department of the company to ensure everyone is on track to meet weekly, quarterly, and year end goals. Although they had an operations strategy in place, they lacked an efficient way to extract the data they needed to help track their team’s progress. Netrix’s Director of Technology, Nick Olerud, needed a solution that would manage the data but also help easily share the data with his entire team for them to know how they were performing. Looking for a Solution Before they became a BrightGauge customer, Netrix knew they had a wealth of information in their Tigerpaw PSA along with their other internal systems that would help them manage their business. The challenge was they were spending a lot of time compiling the necessary reports from various systems. With no centralized data solution in place, Nick was manually pulling data from Tigerpaw and other data sources, then spending up to 4 hours each week creating the team’s scorecard alone - time that he didn’t have to spare, especially when you consider Netrix IT’s rapid pace of growth. Once the team at Netrix had seen BrightGauge in action, they were excited and ready to dive in immediately. Their demo, signup, and deployment took less than 48 hours from start to finish: “Setup time is minimal and the building of gauges and reports is very intuitive.” Using BrightGauge When Netrix signed up as a BrightGauge customer, they immediately began seeing results when it came to making sense of their data. For the management team, leveraging reports and dashboards made it easy to gain critical business insights. But there was also a greater push when it came to the entire team’s performance and accountability. In fact, after deploying BrightGauge Nick could see the results immediately: “within the first week, I could see the team really rally around the dashboard and begin to take pride in the level of service they provide”. the Netrix team and their TAC dashboard Netrix has a very competitive team and the transparency that stems from using the BrightGauge dashboards helps to drive the team’s efforts to the right task at the right time. Displaying Open Service Order [ticket] Counts and SLA numbers (daily and weekly) helps them set the tone for the day and allows them to know when they need to pull in more resources. As Nick describes it, “BrightGauge is really the heartbeat monitor of our Technical Assistance Center. We use it to monitor the response time, workload, and ensure our clients receive the support they expect.” And now when it comes to those weekly scorecard updates, the report is automated and gets delivered to Nick’s inbox every Monday: “The amount of time it saves me while keeping our technical team on task is unmeasurable and completely priceless.” Recommending BrightGauge Businesses don’t run on ‘feel’, instead you need facts and numbers, which BrightGauge brings to the table, explains Nick. He goes on to say “The product is amazing and the people at BrightGauge are top notch. I believe in having a solid relationship with my vendors and clients. I had the opportunity to meet Eric and Larry at the most recent TigerPaw conference and it was a blast to collaborate with them and share success stories.”

[Video] How To Structure Long Term Contracts for MSPs

In the recent months, we’ve seen our MSP Consulting service become more popular as word gets out about the expert advice offered by our co-Founder and CEO, Eric Dosal. With many years of experience in managing his family-owned MSP in the South Florida market, Eric always shares the specific processes and procedures that he used every day to help grow his business. One of the hot topics that comes up during these consulting sessions is how to structure contracts, specifically for a long-term basis. Eric decided to share his advice here in a quick video so that he could give specific examples of the steps he took to ensure the best contract results. The topics covered: why we always used fixed fee contracts contract requirements specific contract verbiage how to guarantee annual contract increases the impact of annual increases

Answers to the Top 5 Questions Heard by our Data Team

One of our major investments in 2015 was the creation of the Data Customization Team. This team now has three dedicated individuals that focus 100% of their effort on ensuring that our customers have their data tailored to the way they want to see it. Here’s a list of the top 5 most popular questions they receive. Meet Kristian, Rick, and Randall: our Data Customization team Can We Get More Data? Yes and no. If you’re on premise, most likely yes. We limit our default queries so as to not put a strain on the SQL database but we often have queries in house ready to apply to accounts for people wanting more data, so just ask! Sometimes they don’t work and we need to limit data being pulled in and often removing data related to automated tickets works best (removing boards or tickets/time entries associated with these automated users). Some databases however do not allow for this extended data pull. We’re constantly looking for ways to make our queries more efficient or find new tables that allow for larger data pulls, so do not hesitate to ask. If you’re using a cloud product, then the answer is most likely no. We’re often limited by the vendors on how much data we can pull through their APIs. That being said many vendors are switching over to newer API protocols and/or changing how their APIs are structured so this could change at any point. This is a continual work in progress to constantly try to bring more and more data for our customers. Can We Add a Custom Field? Yes! Send our team a screenshot of the field you want to use and any associated data. If it’s a custom ticket field, send us the screenshots for a few tickets. If it’s a custom company field, then send that screenshot for a few companies. We will then find it in the database and see if it can be added. Most likely there are no issues and we can add it in at no cost. There are some instances where the data needs to be manipulated and if that’s the case, then we will need to have our Professional Services team take a crack at it, but you never know if that’s the case until you ask us and get the process started! Can We Get the SLA Data in Business Hours? Depending on your PSA, it most likely already is! SLAs are something you’ll configure in your PSA tool and different tickets can be assigned to different SLAs, so if ticket 1 is on a business hour SLA, then BrightGauge will show it with that data. If ticket 2 is on a 24/7 SLA, then BrightGauge will show it with that. Now not all PSAs report SLA data. For those that don’t, we manually calculate SLA data as times from opened to close and that is on a 24/7 clock and unfortunately we have no way of doing that on business clocks at the moment. We Had Our Own KPI Tool In-House Before Signing up with BrightGauge. Can We Get That Data Replicated in BrightGauge? Of course you can! There are two ways to get this tackled: Take a look at our default datasets. Many of these will contain much of the same data that you were pulling in previously, just in a different format. If the data is there, then just build a gauge to reflect the data in the way you want to show it. You can also reach out to us on the Data Team to help you build those gauges. If the data is not contained in the default datasets, then you can take the SQL queries that you were using before and put them in BrightGauge. On your datasets page, you’ll see a “Create New Dataset” button and that’s where you can paste in your SQL query. If it’s an advanced SQL query, then there may be some issues, but our support forum contains documents that can help you format it or our support desk can help you with it too. Just send an email and we’ll be glad to assist. There’s Data I have In-House That isn’t in a SQL Database. How Can I Use It in BrightGauge? Use our DropBox integration! This integration allows users to take spreadsheets, save them as CSV files (a basic form of spreadsheets that most spreadsheet tools can save as), and then upload them to BrightGauge. Info on this process can be found here. Once you’ve uploaded the file as a new dataset in BrightGauge, it will automatically update anytime you update the file! It’s just that simple. Have a question that wasn’t answered here? You can reach out to the Data Team via support.

Our Latest Content

// Siteimprove tracking