Blog Logo-2.svg

The BrightGauge Blog

New Client Reporting Templates for Connectwise, Autotask and Tigerpaw

What service information should I send my clients? How often should I send the reports? These are the two most popular questions we get during the on-boarding process with new customers or when ...
What service information should I send my clients? How often should I send the reports? These are the two most popular questions we get during the on-boarding process with new customers or when customers are initially setting up our Client Reporting feature. The good news is that we have you covered! We’ve already done the homework on the key information you should be sending your clients by providing you with templates per data source. It’s important that we discuss how we developed these templates. We used three techniques: (1) analyzed the client reporting features of our power users (2) surveyed our customers and (3) leveraged our own experience from our MSP. What came out of this 2-month long research project are our Client Reporting Templates, which we have shared with all customers. But it’s important to note that these are a “starting point” to help you get going. From here you can build more customization or make adjustments as you see fit. For our PSA data sources, Connectwise, Connectwise Hosted, Autotask, and Tigerpaw we focused on just a few simple gauges: Service Summary This shows tickets that are currently open, tickets opened last month, and tickets closed last month. This gauge is a great snapshot into the services details for the prior month. Open vs Closed Tickets This gauge is a perfect visualization into how your team is keeping up with the demands of the client. If there are more tickets open than closed (meaning your service backlog is increasing), then there should be a point of discussion with your client on how you can address this. Service Level Agreement (SLA) If your data source provides SLA information that allows us to document the average time it takes to acknowledge or respond to a ticket, it’s important to share that with your client. This shows that your team is being responsive to their requests which is one of the most important characteristics a client expects of a service provider. Tickets Opened By Type This pie chart shares the type of tickets your client currently has open with you. This gauge provides a wealth of information on what type of work your client is requesting of you. One glance at this gauge tells a story of the different types of support you are providing - and if the support is off, what’s expected based on the contract. This is your opportunity to review with the client and make adjustments. Most Active Users This is one of my favorite gauges to share with clients because it helps immediately identify the “problem users” that may need some extra coaching or training. We all have a few noisy users in our client base who have a tendency to open the majority of the support requests, and this gauge allows you to bring it front and center. In summary, with these 5 key gauges you’re able to show: All the work you have done for the client How you’re responding to their requests Whether your team is keeping up with the volume The type of support you are providing The most active users that you’re spending the most time on This summary speaks volume about the value you’re providing! To learn more about how you can ensure client happiness and save a ton of time by skipping the manual report process, check out our free webinar:
request-a-brightgauge-demo

[Case Study] CadreNET saves 25 Hours per week using BrightGauge

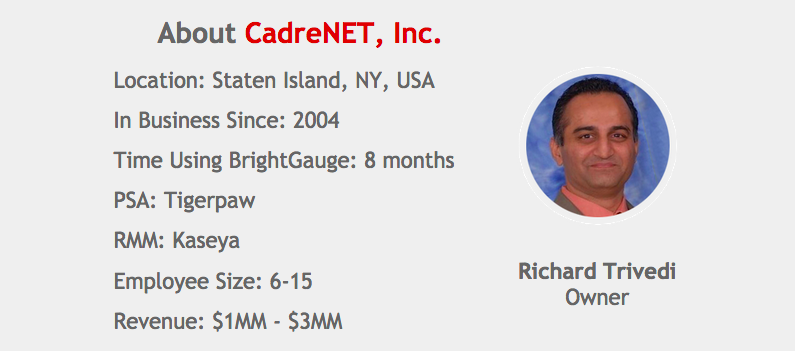
In the beginning, CadreNET was manually producing reports along with using built-in dashboard functionality from their PSA, Tigerpaw. They lacked an efficient way to produce internal reports, monitor their business or even make metrics-based decisions. Owner Richard Trivedi found a solution using BrightGauge to monitor not only his business, but his team as well. Needing a Consistent Business Update As a Managed Service Provider, it’s critical for CadreNET to process data quickly and accurately. But when it came to their built-in software resources at hand in Tigerpaw and Kaseya, they were missing a way to tie all their metrics into one easy-to-monitor resource. The management team was left to manually produce timesheets, income reports and more - a serious time commitment for a team focused on growing their business. With 12 metrics to check and a processing time of 10-15 minutes per metric, the minutes quickly turned into hours for each status update. Furthermore, they found that when they did run reports from their softwares the data was often inaccurate and never gave them the right figures. Building a Data Process As Richard immediately realized, he and his team were desperate for a dashboard solution that would keep them up to date throughout the day with real time data. After realizing that BrightGauge did not yet integrate with Tigerpaw, Richard evaluated other solutions in the market but was very disappointed by poor follow-up and customer communication when installations failed on deployments. After this frustrating experience he decided to put the project on hold and revisit in the future. Within a week of moving on, Richard received an invitation to be a Tigerpaw Beta tester with the BrightGauge team and instantly volunteered to help. He found the setup to be very simple: with our standard instructions plus a quick introduction call from our team, Richard was up and running by himself in less than 10 minutes. The BrightGauge Experience Using the BrightGauge platform, Richard now has real time information in front of him that helps significantly when it comes to making business decisions. Being able to monitor time entries made by his team also gave Richard access to tracking their performance, greatly reducing missed tickets entered into Tigerpaw. At roughly 10% of billable tickets being lost prior to BrightGauge, the money reclaimed moving forward was a notable win. But besides the money gain, Richard noticed an even larger feat when it came to his time savings. By using the BrightGauge gauges and dashboards as compared to running reports himself, Richard saves an average of 20-25 hours each week. Recommending BrightGauge “There are many reasons [to recommend the platform] but product performance and support are always the two main reasons, and BrightGauge has surpassed my expectations on both. My most positive experience has been working with the team - they are top notch and always willing to help. I was extremely pleased with the product and team from Day One.”

Subscribe to get the latest content delivered to your inbox

Free Webinar: How Investing in Customer Success Drove Our MSP Growth

Join us on September 22nd at 11:00am EDT to learn about How Investing in Customer Success Drove our MSP Growth. In this 45-minute session, our co-Founder and CEO, Eric Dosal, will guide you through a closer look at why Customer Success is a key factor in the growth of any Service Provider business. As the former owner of a MSP business, Eric knows first hand about the need for account management and exceeding a customer’s expectations. He’ll open up his personal playbook and discuss the steps and the data that were behind each decision he made while managing to grow his MSP into one of the largest in South Florida. During this discussion, Eric will cover several topics that are essential to implementing and managing a Customer Success program, including: What is Customer Success? How Customer Success Impacts Churn Key parts to a winning Customer Success process What should a Customer Success person/team look like Customer Success KPIs Open Q & A and much more! You’ll walk away with actionable insights on the steps you should take to kick off a Customer Success program, whether you’re the MSP owner or the person in charge of Sales. We hope to see you at the next session in our ongoing BrightGauge Educational Webinar Series! To RSVP, click the image above or visit: How Investing in Customer Success Drove Our MSP Growth.

3 Ways BrightGauge Helps Keep Your Clients Happy

"Why do I pay you every month?" The dreaded question of any service provider. So how do you combat receiving this potential question? According to Harvard Business Review, it can be up to 25 times more expensive to constantly acquire new clients instead of keeping your existing clients on board by ensuring their happiness. And, more than 50% of customers switched service providers in a single year after poor customer service according to Accenture’s Global Consumer Pulse Survey. Sounds like the obvious approach is to make sure you have happy clients. Based on the stats, we decided to spend a few weeks meeting with our fastest growing partners. We uncovered 3 key reasons why they are using BrightGauge to keep their clients happy and engaged. Sharing That You Provide Top Notch Service Become a True Partner, Not Just a Vendor Show Them The Information They Want, When They Want It Sharing That You Provide Top Notch Service At the end of the day we are all in the client Service business and you as a MSP just happen to use technology to provide that client service. Your clients are counting on you to provide the very best support possible and expect you to deliver on what you promised. By sharing with your client all the tasks you have accomplished during the previous month it allows you to highlight the tactical impact you have on their business. Become A True Partner, Not Just a Vendor Technology is at the center of everything we do and as MSPs you provide an incredible service that enables companies to function on a daily basis. Our partners prepare and deliver their client’s reports and use that as an opportunity to have conversations with the decision makers on how their technology is performing. These conversations allow you to “Move Up The Stack” which is one of the key lessons we shared in our Sales Best Practice Webinar. Show Them The Information They Want, When They Want It Your clients are already getting bombarded with emails and status updates from every vendor, partner, software, company they interact with. So a great way to differentiate yourself is to customize the information you are sending your client and the frequency that they receive it. By taking the time to understand what they are looking for and provide them that information when they want it, it will make you stand out above the crowd. To learn how Client Reporting can make a huge impact on your business check out our free webinar where we discussed how Client Reporting is a key pillar in the area of Customer Success.

Tigerpaw Expansion Offers Opportunity, Invoice, Task & Quote KPIs

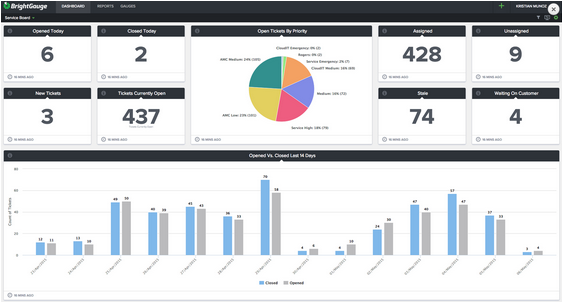
Today we’re excited to share that BrightGauge has announced 24 new KPIs for our Tigerpaw partners, helping make a great product even better and bringing the integration to a whole new level. We announced our original integration earlier this year with an initial focus on Service Orders and Time Entries data. This included the release of our Tigerpaw Best Practices Dashboard (shown below). But upon further investigation of the Tigerpaw Software and initial feedback from our Tigerpaw Partners we knew we had only scratched the surface of the data they need to run their businesses and decided to dive into Opportunity KPIs, Invoice KPIs, Task KPIs, and Quote KPIs next. Below is a list of all the new KPIs we released including a few screenshots of the most popular ones. To learn more about our integration please visit: Tigerpaw Integration Overview and for our existing customers that want assistance on how to customize these metrics please reach out to our Data Team. Opportunity KPIs Opportunities Closed Last Week Open Opportunities By Type Open Opportunities By Stage (pictured below) Revenue Pipeline Next 30 Days (pictured below) Revenue Opportunities Currently Open By Sales Rep Invoice KPIs Invoices Paid Last 30 Day by Account Invoices Paid - Last 30 Days Outstanding Invoices Count Outstanding Invoices By Account (pictured below) Outstanding Invoices Total Amount Trailing 12 Month Revenue (pictured below) Total Revenue Amount Last Month Outstanding Invoices by Aging Status Top 25 Balances Due by Account (pictured below) Task KPIs Open Tasks (pictured below) Open tasks Past Due (pictured below) Open tasks by Member Open tasks Past Due by Member (pictured below) Open tasks by project Open tasks by opportunity Quote KPIs Open Quotes Open Quotes By Rep Open Quotes By Status Open Quotes By Account

70+ Metrics for MSPs

Key metrics and accompanying formulas to help MSPs skyrocket growth and success!

Get your KPIs

How BrightGauge Works: A 30,000-ft view

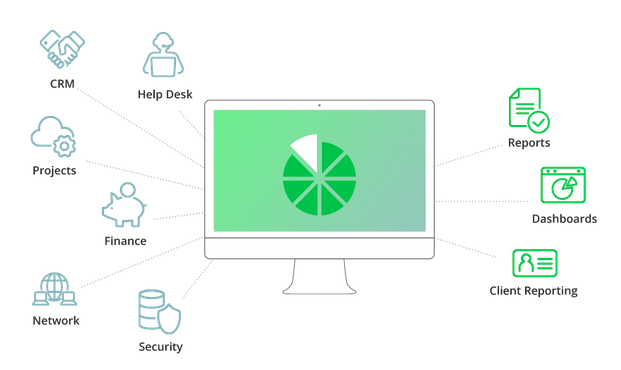
What is BrightGauge? BrightGauge is a web based application that serves as a data visualization and centralization tool for your current PSA, RMM, and Finance software(s). We help you get the most out of your data source(s) by accessing, grouping, and simplifying data that most of these tools have “hidden”/stored in their databases across multiple tables without a simple way to display or report on. Apart from accenting each software individually, BrightGauge allows you to bring together multiple data sources into our platform, whether it's an on-premise system with our secure agent or connected via an API to a hosted provider. These tools are typically built as silos with limited interoperability. Each has its unique strengths, but they keep their proprietary content “locked” internally, leaving gaps and incomplete coverage in your business. We help you break down the barriers of these data silos and bring all your key business data together. In order to help you leverage your data, there is a three step process from your datasource to the end result visualization that we will define now and explain later. The key definitions are: Datasets - The Raw Data we extract from your datasource, normalize a bit (like dates), and then make available to you to create visuals. Gauges - These are the visualizations of the data. The charts, numbers, lists, or tables that are created as representations of the raw data. Reports & Dashboards - These are the areas where you can place your gauges for regular viewing. Now that you have that basic understanding, read below for key differences and more detailed definitions of each of these terms. Datasets vs. Gauges Datasets and Gauges are what power the BrightGauge app; datasets serve as a backbone while gauges serve as a brain per se. Gauges use these fields to display information in the form of several charts such as tables, vertical bar graphs, line graphs, horizontal bar graphs, pie charts, number headings, lists, and tables. Dashboards vs. Reports Dashboards and Reports are both tools that are built off of Gauges and are used to group, display, and share data. Just like Gauges, Dashboards and Reports are customizable and can be tailored to best fit your needs.

Maker vs. Manager: Why Scheduling is Key in a Hybrid Role

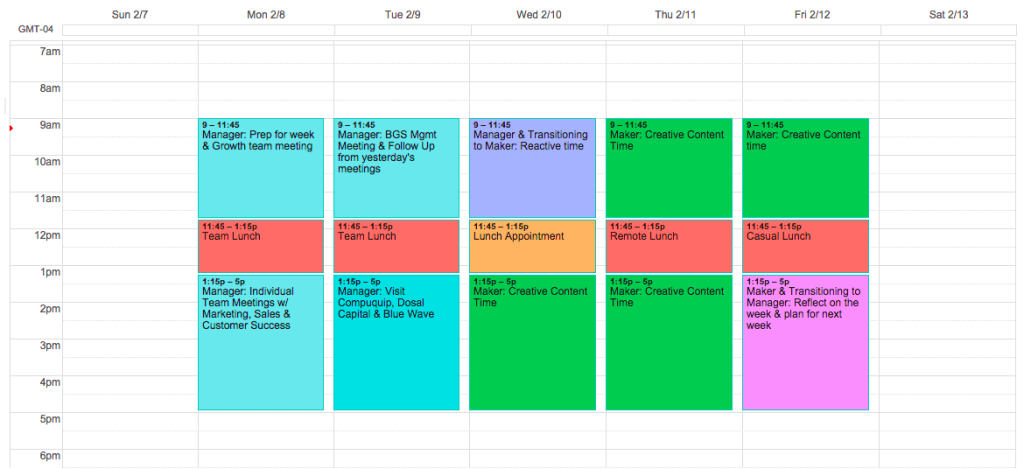
Over the past few months both my brother and I have been doing a lot of customer calls and really diving deep into better understanding what our customers’ challenges are and how we can better help them. I also recently covered sales while Larry was out of the office and speaking to our customers and prospects reaffirmed that one of the challenges I keep hearing about is time management. When I dove further into the topic with those customers I realized that I struggle with the same challenges as a CEO of a small but growing company. So I have been reflecting on the topic quite a bit the last few weeks, all the while researching different productivity hacks on how I can improve my output. But those were all minor solutions that didn’t really address the core problem. And then I came across Paul Graham’s very famous essay on Maker’s Schedule vs Manager’s Schedule, and it hit me, that’s IT! So today I wanted to share what I found out and what I’m doing about it as it may help each of you. First a little background... Like many of my customers, I wear a lot of hats, professionally. My main focus is being the CEO at BrightGauge, but as a small company (I no longer consider ourselves a "startup"), that doesn't just mean CEO duties, that includes a whole bunch of other things. I spend most of my time managing the Growth Team so I work on Marketing campaigns, helping with sales deals and pipeline management, following up on implementations and professional services work, etc. When I'm not focused on specific Growth Team tasks you can find me handling the finances and following up on past due accounts. And that’s just the BrightGauge stuff - there is also a portion of my time spent at our other family businesses Compuquip Technologies (Internet Security), Dosal Capital (Finance & Investments), and Blue Wave Communications (voice & data cabling). The Challenge So yes, I wear a ton of different hats. And I'm ok with the different hats as it keeps it interesting, however after reading Paul’s essay it struck me that my biggest challenge is bouncing from Maker (the doing) to Manager (the managing) because those are two completely different skill sets and approaches to work. As an example, some of my responsibility is to manage others and make sure we are aligned with our goals and heading in the right direction, that's Manager stuff. Then I also have to contribute to our blog posts, draft up content for our podcast, follow up on support tickets, jump on demos with customers... that's Maker stuff. Switching gears between the two is very difficult if you don’t properly plan for it. My Solution For now what I'm doing is blocking off time for each type of work and dividing my days as best as I can. So far it’s been a huge help and I’ve really been able to focus and feel a lot more productive. Here's a screenshot of my current schedule blocks: It’s not a perfect solution but I definitely feel progress and that I’m heading in the right direction. How you can apply this to your business Although you may not realize it, you might be experiencing the same challenge. It may not be exactly the same as me but instead related to splitting your time between managing the team, still billing those legacy clients that depend on you, doing the vCIO work for your big clients, or making sales calls, etc. Depending on the size of your business and the ability (time and financial) to hire more resources you may have to stay in a hybrid role. The key I’ve found is to identify how you work best in each role and make sure you're mentally prepared and focused for each.

Tips on Identifying Your Ideal Customer, with Richard Tubb

Join us on August 27th at 10:30am EDT (3:30pm BST) for Tips on Identifying Your Ideal Customer. During this 45-minute webinar our co-Founder and CEO, Eric Dosal, will be joined by Richard Tubb, one of the most well-known consultants in the British Managed Service Provider (MSP) business. As the former owner of a MSP business, Richard understands the challenges IT business owners face every day and can help you to overcome them while retaining what's left of your precious sanity. We’ve worked with Richard on other topics in the past (Internal Metrics that Matter for MSPs) and the feedback was excellent, so we knew it was time to bring him back again for an in-depth discussion on a challenge that many Service Providers face - how to choose the right customers for your business. During this discussion, we’ll cover several specific topics so that you walk away truly understanding which customers deserve your precious time and energy: Understanding the different types of customers Red flags in the Sales Process How to spot a bad customer Finding a customer’s budget and so much more! Whether you’re the MSP owner or the person in charge of sales, you’ll walk away ready to implement proven techniques from an industry veteran. To access the webinar recording, click the image below or visit: Tips on Identifying Your Ideal Customer.

3 Benefits of Using Dashboards as a Sales Tool

As a newcomer to the world of software and IT Services, I knew when I accepted the Inbound Marketing position at BrightGauge that it would be an incredible learning opportunity. So when our co-Founder and Product Manager, Brian Dosal, suggested that I participate in a few customer feedback calls I was excited to learn more about the benefits each customer sees - besides the obvious solution for creating reports and visualizing data. Nearly every customer we’ve spoken to so far has mentioned that they would love to know more about what their colleagues are doing with BrightGauge dashboards (point noted by yours truly). As I was taking notes and letting it all sink in, there was a pattern I noticed within the first few calls and I have to say it took me a bit by surprise. Our customers are making great use of Dashboards as a Sales Tool when signing up new clients for Managed Services. So in the spirit of kicking off our new efforts to share customer success stories, here are the 3 Sales Benefits the BrightGauge community sees as a result of having their dashboards on display: Quality Control Potential clients want to know how a MSP keeps tabs on the criteria as outlined in their contract. Think about it. Who comes to these Service Provider facility tours and makes the decision to sign up or keep looking? Chances are it’s a C-level group: folks who are up to their eyeballs in meetings, emails, paperwork and phone calls. With dashboards in place, it’s easy to keep a pulse on what’s happening and make any necessary changes in real time. It shows that a Service Provider is committed to tracking and maintaining performance and also ties into the time agreement of the SLA. Differentiation from the Competition In today’s market with so many options for IT Support it's important to stand out in the crowd and show your prospective customers you are different. Having dashboards up in your office shows that you take your service seriously and that you are on top of what your team is doing. You would be surprised at how often we hear this is a factor in a prospective client’s decision making process. Aesthetics Let’s be honest, it’s human nature to be drawn to things that look good and please our eyes. We’ve heard several of our customers say that while giving office tours to prospective clients, having dashboards on display helps with the vanity factor. They look cool, and having TV displays offers a modern take on the old spreadsheet charts and graphs from years ago. Dashboards impress those same execs because the data is current and updates every few minutes. Nucleus Networks displays several dashboards throughout their office It’s exciting to be able to share new ideas within our community, so I hope you’ll stay tuned as I continue rounding up notes from our customers about ways they’re using BrightGauge. Oh, and if you have an idea or a beautiful dashboard photo to share with our community? I can be reached at amccluney [at] brightgauge [dot] com. Want to learn more about Sales Best Practices? Hear about the lessons our co-Founder and CEO, Eric Dosal, learned while growing his MSP practice 10x in 5 years [free webinar download]:

Adam Merille joins BrightGauge as Web Developer

We’re thrilled to announce that Adam Merille has joined BrightGauge as a Web Developer! The younger years As a Miami-area native, Adam spent his first university days at Miami-Dade College, where he graduated from The Honors College with a focus on Anthropology. After graduation, the world was calling to be explored so Adam took six months off and used that time to travel around southeast Asia in Thailand, Laos, Vietnam, Cambodia and Burma. It wasn’t long after his return that he felt the need to continue his studies and so he enrolled at The University of North Carolina where he would major in Global Studies with a focus on Asia and minor in Religious Studies. During this second school phase, Adam also participated in a study-abroad program allowing him to live in China for a semester. After his days at UNC, Adam accepted a job with Fidelity Investments as a Financial Representative, but realized after a while that it wasn’t his calling, so he resigned with a decision to learn more about programming. After some initial learning on his own, Adam enrolled at Florida International University for Computer Science. He studied a lot, signed up for any internships that came his way and even worked with BrightGauge on his senior project. Long story short, he is now the freshest face on the BrightGauge team! Looking to the future at BrightGauge Adam tells us he is excited to work with our team because we have fun while working hard. While he was looking for an opportunity to learn more about web development, he specifically chose BrightGauge as his home because of our company culture and because we have “a product that people love and the company is always trying to make it better” (we couldn’t agree more). Plus, working in a small company gives Adam much more exposure into the different aspects of the business while also enabling him to contribute in ways outside of the standard job description. Behind-the-Scenes scoop Outside of our office, Adam is most likely to be found reading books/articles, watching movies or of course traveling the world. Besides his stops in Asia, Adam has also spent time in Turkey, Austria, Costa Rica, Nicaragua, Belgium, Guatemala and more. It’s safe to say that Adam loves trying new food and experiencing different cultures, whether he’s out leaving his mark on the world or right here in his hometown of Miami. Please join us in welcoming Adam to the BrightGauge team!

5-Point Checklist: Hosted vs. On-Premise BI Solution

Let’s face it, the cloud is here to stay! And I can really feel a big shift within our customer base as the cloud becomes more prevalent in small to medium businesses. Back in 2013, when I was doing every demo before we had a rockstar like Larry Garcia on board, answering questions about BrightGauge being a hosted platform was commonplace. Flash forward to today, and in the conversations we’re having now with prospective customers, the topic of hosted being a negative rarely comes up. As a matter of fact people see it as a huge benefit. We are no longer having to deal with objections because we are a hosted provider and can jump right into how we can make an impact on our customer’s business. Here are the Top 5 benefits we hear from our customers about using a hosted platform: No Overhead to Manage When you leverage a hosted solution, it limits the overhead (physical and personnel) that you need to deploy or manage. The days of having an on premise solution where you need to download an application and load it on a device physically in your office are way behind us. Not only does that take a ton of time to deploy but then it’s another piece of hardware/software you need to manage. As a small business, the less you need to deal with the better. Lower Costs: Implementation & Ongoing The pure nature of not having to manage anything locally on your network means you are bringing the cost to implement the application down. With no hardware to buy and no servers to purchase and set up, you’re also saving money on the labor hours for installation. When it comes to the ongoing maintenance and upgrades required for software, a subscription-based service will save money because there are no patches to install and no IT resources required since maintenance responsibilities fall to the service provider. If you need more proof about the cost scale, don’t forget that a quicker implementation means a quicker Return on Investment. Hosted solutions can often be up and running in days or weeks, compared to the old-school traditional implementations which can take months on end. Security of One vs. Many One of the breakouts I enjoyed at the Gartner conference earlier this year was around the cloud and security. I’m not suggesting the cloud is 100% secure but cloud providers have a lot more to lose and lot more resources to dedicate to security because they are protecting many customers, not just you. So you get the benefit of their expertise without having to deal with it yourself. Scalability Leveraging the infrastructure of a hosted provider allows you to tap into their ability to scale up (or down) as needed. Most Software as a Service (SaaS) providers make it very easy to scale their platform to meet the needs of their customers. At BrightGauge we pride ourselves on the ability to offer a solution that meets the needs of a small company with less than 5 employees but also scale to meet the needs of our larger customers with 200+ employees. Easy Sharing With an internet-based solution, users can easily share their data. So whether they’re working with a customer, on a team project across multiple office locations or even with a teammate in the field, location will never hold back sharing capability. It’s a fact. The cloud is here to stay (along with hosted software platforms) and will only continue becoming a more regular fixture in our technology stacks. When it comes to selecting the best BI solution for your company, my advice is to start comparing your choices based on these 5 key business benefits. Once you can weigh the pros and cons of overhead, costs at hand, security, scalability and ease of sharing, you’ll be able to select the best match for your software needs.

Our Latest Content

// Siteimprove tracking