Blog Logo-2.svg

The BrightGauge Blog

Part 1: Lessons Learned from Starting, Growing & Selling our MSP

Last year I gave a talk on 6 Lessons Learned from Starting, Growing and Selling my MSP Practice and it has become my most popular topic when asked to speak. Several people have asked for a copy of ...
Last year I gave a talk on 6 Lessons Learned from Starting, Growing and Selling my MSP Practice and it has become my most popular topic when asked to speak. Several people have asked for a copy of the slide deck (you can download here) but I took it one step further and recorded the presentation to share with our BrightGauge community. The entire talk is pretty long so I broke it up into sections and below is Lesson #1, Put a Sales Process in Place. This is a topic I’ve shared before on this blog when I wrote about the 4 Steps of a Successful Sales Process and its a main theme in our Sales Best Practices Series. In the video recording I expand more on the topic sharing about how we turned this sales process into a machine for us to grow. To learn more best practice tips on how we grew our MSP 10X in 5 years please join us for our upcoming webinar => Sales Best Practices on May 13th at 11:00AM EST
request-a-brightgauge-demo

5 Key Details You Need For Every Sales Opportunity

An opportunity without all the necessary information and data points is NOT a true opportunity. I’ve written before about how important a sales process is for your organization, and here is one of the next steps you need to take to elevate your sales process to the next level. Removing the "clutter" from your sales pipeline helps you more effectively evaluate the opportunity and helps you identify the most lucrative and well qualified leads. I've always managed my pipeline in the same way, and it's been extremely effective for me. One of my cardinal rules is all the data for an opportunity must be completely filled out before I consider it a true opportunity. Let me break this down a bit more with 5 critical components. Opportunity Type This is a critical piece of data. If your team is very good at predicting closure dates, you should be able to better plan your delivery capacity. Another way to track this information is to look at how this type of revenue has closed historically. Getting a feel for the trend information about this specific opportunity is a good way to determine future outcomes. If you need a refresher on revenue types, check out an earlier blog post on why revenue by type is a KPI you need to monitor, which details how we leverage that information effectively. Opportunity Amount In order to effectively fill in this type of data, you may need some help from another team member or resource to get the most realistic price points. For example, you may need some engineering support to help you scope the amount of hours for an infrastructure upgrade or back-up software deployment. You also need to determine if the opportunity is reasonable and realistic. I used to have a sales rep who would list out "Network Upgrade" because he constantly heard that buzzword during the meetings. Unfortunately, an upgrade could cost over $20,000, depending upon the sophistication of the network, so until the amount is better qualified it’s tough to judge it’s validity. Opportunity Next Step In an earlier post, I described how creating and enforcing a sales process that included a next step increased my closure rates by 40%. In my experience, this is the most important part of the opportunity. Opportunity Status You need to be well aware of the status and progress of every opportunity within your sales process and be able to identify when an opportunity might be "stuck". Some companies create a complicated process with a ton of steps, but I believe you can streamline this process into four steps, Connect, Qualify, Evaluate, Decision. Opportunity Expected Close Date Have you ever reviewed the opportunities in your pipeline and realized they all have the same month's end close date. If and when the deadline passes, you or your sales team simply updates the Expected Close Date to the next month's end. If you're not experiencing this then your sales team is meeting every close date and is the greatest on the planet. I know its difficult to predict close dates, and the power tends to lie in the customer's hands, but it's important to have estimated close dates. Accurate estimated close dates help you better manage your long and short term resources. None of these steps are rocket science, but they do require discipline and organization in order to ensure all the steps are completed properly and the data points are filled out. If nothing else, these simple steps will encourage your sales team to input only real opportunities, force your sales reps to properly qualify the opportunities by investigating and documenting the right information, and be more thoughtful before slapping a bunch of random items into your pipeline. Organizing your sales process takes a little planning, but eliminating excess information and clutter from your sales pipeline allows you and your sales team to focus on the most qualified opportunities.

Subscribe to get the latest content delivered to your inbox

6 Ways to Make Metrics Useful to Your Business

With the increase of measurement processing, recording and entry into databases, metrics have become integral for every business. Metrics applied to measuring customer acquisition, retention rates, service efficiency, and time entry give businesses information to act with confidence. With so much information, having the right tools to interpret data is extremely important. Metrics, often overwhelming, are usually relegated to big companies with big budgets and mathematicians on staff. With the right software, metrics do not have to be overwhelming or require programmers and engineers on staff. Companies like BrightGauge offer solutions that provide the following six ways to increase the usefulness of metrics to your business. Access your businesses data: Servers, cloud hosting sites and many other programs generate data. The right software will bring all these data streams into one location. Consolidate data: Data can be overwhelming. The right software takes the different measurements, statistics, and single pieces of information; it organizes the data so that you can use it. Allow for customized metrics: Applying different metrics to data quickly and efficiently is one of the most powerful aspects of high speed computing and big data. Intuitive metric management: Customized metrics can overwhelm the average user if it is not managed intuitively. Software that manages metrics needs to be intuitive so that small businesses can tap into their data without excessive training fees or staffing. Create unique, custom visuals: Humans process most of our information visually. To communicate from a data to a human, the metrics need to be presented visually. Good software will make metrics visual to the user. Generate useful reports: Visuals are enhanced greatly when data is organized and reported. With the right tools, your business can make use of the data that your current software and management tools are generating constantly. To be able to access, organize and review data is highly valuable. Metrics do not have to overwhelm you, there are many solutions available to give you the tools to use metrics to your advantage. To learn how you can Improve Your Business with KPIs please download out latest white paper:

Managing the Flow of Tickets Between The 5 Important Stages

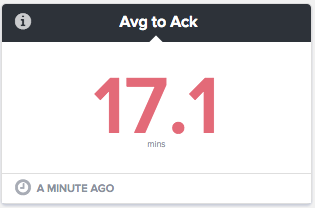
In our last Service Operations Best Practices we discussed the definition of the 5 Most Important Service Ticket Statuses Every Team Needs To Manage but now let’s turn that into practical action on some tips on how to best a ticket that flows through each of the statuses and what it means. For those of you that are Connectwise Partners you can also use these statuses to manage your SLAs, to learn more please download this slide deck New => Assigned - the first step in the process should be to move into the Assigned status. Moving the ticket from New to Assigned allows you to respond to your customer acknowledging their request (SLA). This communication can (and should be) automated so they know you’re aware of their issue. Its important to track the time between New to Assigned or 1st Response. Below are two of the most popular examples of how you can track it, either with a Number Gauge (that changes colors based on thresholds) or if you want to see a longer term trend: Assigned => In Progress - once a team member is ready to work on a ticket they should change the status to In Progress. A small subset of customers will introduce an automated communication to their customer when this change happens. The challenge with this step is many times team members will push back saying they can’t keep “updating tickets” every time they start and stop working on an issue. The reality is this is true and therefore the data should be reviewed carefully. For those of you using Connectwise, below is a sample on how you can monitor the amount of time before a ticket gets worked on: Any Status => Resolved - Once the work has been fully completed on a request the ticket should be moved to a Resolved status indicating the work is complete. This is a great communication point to notify your customer that the work is completed and ask them for confirmation. Measuring the amount of time it takes to Resolve tickets is one of our most popular metrics and this is a metric you’ll want to monitor over the longer term as well (see screenshot of 30 day trending average). Any Status => Pending - A ticket should be in the pending status when its “pending” some other action and that action may be in the hands of the requester (waiting for feedback or for them to return) or from your team (waiting for help or escalation) or 3rd party (waiting for a part). If you are managing your team with SLAs then this status should “stop the clock” if its anything besides waiting on your team. Meaning if the pending is not controlled by your team then it should stop the clock. It’s important to be aware of this distinction and just know how your system is set up so you don’t run into issues. The most important part of this process is to make sure it’s documented and shared amongst the team so everyone is on the same page.

5 Most Important Service Ticket Statuses Every Team Needs To Manage

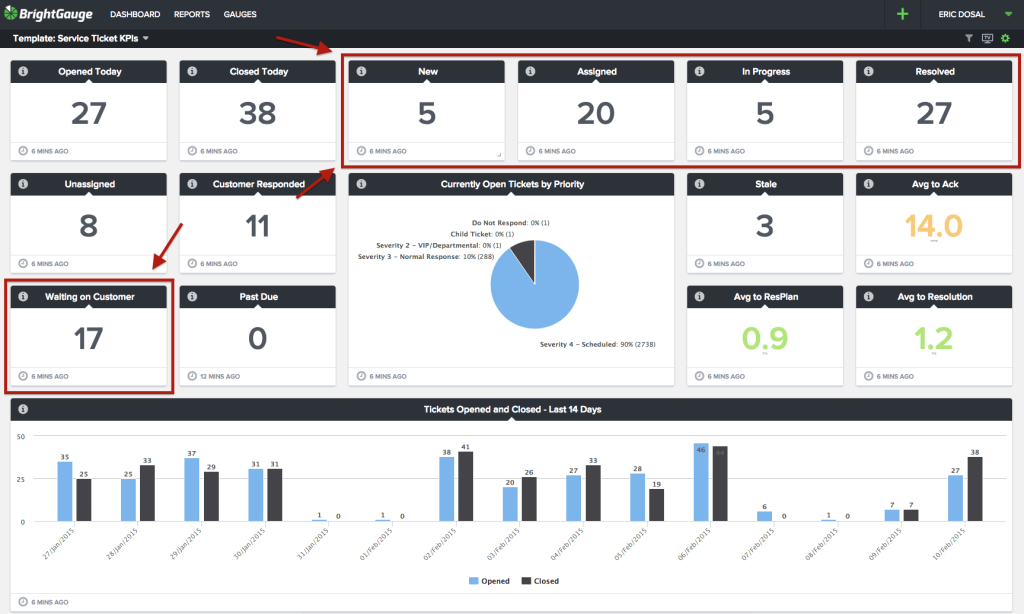
This is a the 2nd post in a series of posts based on our Best Practices for Service Ticket KPIs. You can read the first post here: Open & Closed In this post we’re going to dive into Ticket Statuses and how this critical component of a ticket can provide tremendous insight into how your team is performing and if there are any bottlenecks in the process. But first, let’s make sure we’re all on the same page regarding the different types of Ticket Statuses and what they each mean. With over 10 years of experience running customer support teams that have ranged from 1 person to 30+ people, I have found that the more simple your ticket statuses are the more value you will get from the data it provides. When I meet with customers and review their Service Team Metrics I’m shocked at the number of ticket statuses companies have. In my experience a ticket can only be in one of 5 statuses at any given time and the closer you keep the statuses to these 5 simple ones the easier it becomes to manage all the tickets (note, these status types are not just for service tickets it can cross over to any type of work). The 5 statuses are New, Assigned, In Progress, Pending, and Resolved. Every other status that you have on your tickets right now are simply sub-statuses from these main ones. New means the request has been submitted but your team has not responded (key for those that track SLAs) and most probably has not reviewed it either. Every request begins in this state. Assigned means the request has been reviewed and “assigned” to someone to begin working on it. This should be the first step in the request’s journey through your process and allows you to confirm with the customer that you are aware of their request (think response times for SLAs). In Progress means the request is actively being worked on by one of the team members. The number of “In Progress” tickets does not need to equal the number of team members, i.e. everyone is working on a single ticket, because the reality is team members may work on multiple tickets (that’s ideal). Pending means that the person working on the ticket is at a stopping point waiting for some action to occur before continuing working on the request. The most popular reasons for this status are (a) waiting for feedback from the requester (b) waiting for a 3rd party (i.e. vendor to ship a part) or (c) waiting for help from one of your team members like when escalating to someone else. Resolved means the request has been completed and no more work is required. Best practice is to confirm this with the requestor but more often than not it's unrealistic to expect this to happen. Each time I run into customers with over complicated statuses I remind them to get back to basics and focus on each of these main statuses to help ensure tickets are swiftly moving through the process and customer’s requests are getting addressed and resolved as quickly and as efficiently as possible. To learn more about how you can drive more Efficiency and Profitability thru Service Management, check out our webinar recording on the topic here: Download Webinar

70+ Metrics for MSPs

Key metrics and accompanying formulas to help MSPs skyrocket growth and success!

Get your KPIs

MSP Key Performance Indicator: Open and Closed Tickets

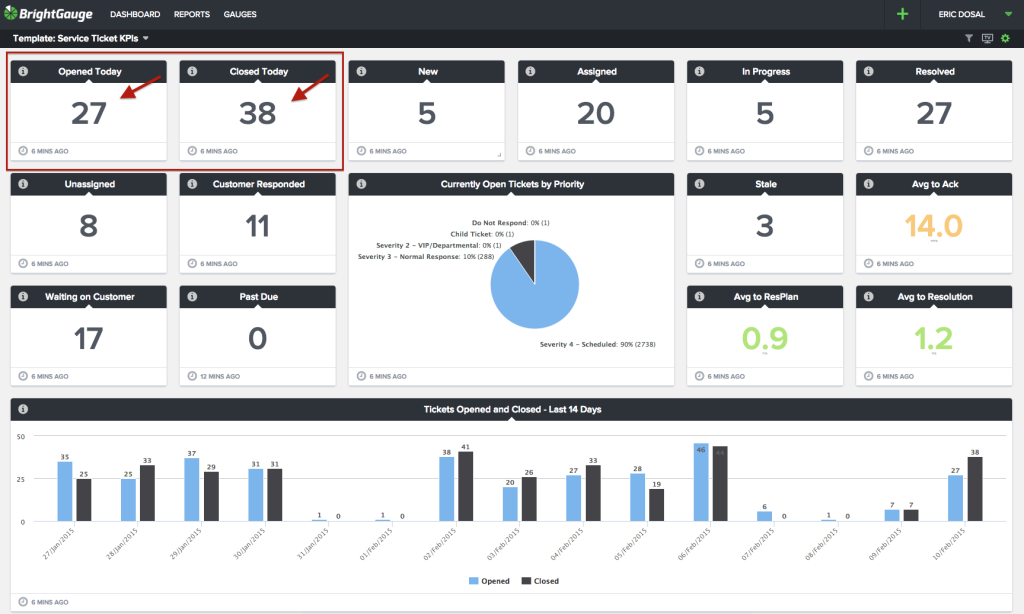
My two favorite gauges when it comes to support are Opened and Closed counts for a given time period. In the top left corner of every service dashboard I have ever had, which is where we instinctively first look, is the Open and Closed ticket count. Here’s a screenshot from our service dashboard right now: The number of Open and Closed tickets can give you a wealth of information in a split second. For the sake of this example, let’s assume the time period is “today” meaning we’re looking at tickets opened today and also tickets closed today. Count - The actual number is a great indication of the overall volume of tickets for the day. You know the time of day it is and as you get used to seeing the number you will naturally begin to know if the ticket count is high or low for the day based on the trends. That will help you determine if there has been a spike of activity or not. Comparison of the two Counts (i.e. Open vs Closed) - The dream of any service team is to close more tickets than are opened during a given time period, bringing the service backlog number down. So for this example, we would want to close more tickets than are open for a given day. However at any given time when you look at the two numbers and compare them that’s when you get a snapshot of whether the team keeping up. Below are two examples of Open and Closed Tickets that I took from our own internal service dashboard yesterday, as you can see from the first image from 2:30pm, we were behind: Then we had a quick huddle to figure out what was going on and how we were going to attack the problem. We got another team member assigned to help out for a few hours and here is how we closed out the day: If your team is not keeping up with the tickets being opened every day and that pattern continues you may put yourself in a position where the backlog of tickets becomes too large and difficult to recover. That’s why it’s important to regularly monitor your Service Backlog which is simply the difference between your Open and Closed tickets. Below is a screenshot of how that looks: Next time I’ll share some best practices we used to do at Compuquip and still do at BrightGauge to help with Service Backlog Management. In the mean time, to learn how you can Improve Your Business with KPIs on Dashboards please download out latest white paper:

Internal Metric Reporting Tips

Tracking external metrics such as leads, traffic, and conversion rates are pretty much a given. But what about internal metrics? There are many types of internal metrics with specific measurements you should be tracking to help ensure greater effectiveness, efficiency, and predictability for your team. The following are a few tips to optimize your internal metric reporting processes. Choosing the right metrics is critical to success. Identify metrics that the team can implement today, but which, ultimately, will affect the firm’s long-term goals. Most managers and employees work hard. The goal of a metrics system should be to make them work smarter. Involve the managers and employees. Those who are subject to the metrics systems should be part of the team that is responsible for developing them. Any metrics system which is simply imposed from above without participation from those it impacts is likely to encounter resistance. Metrics enable you to get the most out of your managers, employees, and current work processes, but they should not limit you. By considering your goals creatively you can develop new processes. Metrics alone are not enough. Insights are critical and necessary to drive action and shape strategy. Data and insights need to be democratized and shared company-wide, allowing for full transparency and a common language for the company to engage in. Common Mistakes Too much data - The metrics you choose to focus on should be relevant, actionable, timely, and measurable. Determine and define the metrics that are related to your particular needs and goals. Lack of reliable data - You should never obsess over numbers. Instead you should look at the big picture and how the whole system works. Nevertheless, metrics must reflect the purpose of the business. Measuring and collecting data, which is often part of process improvement initiatives, brings to light what is happening in all processes within your organization. Many organizations struggle with setting benchmarks, measuring progress toward goals and evaluating past performance. But by keeping the above tips in mind, internal metric reporting doesn't have to be difficult. To learn more about Internal Metrics That Matter for your MSP download our whitepaper.

What We Learned From 3 Days At TruMethod's Winners Circle

Last fall, I was fortunate enough to have an opportunity to spend three days with the TruMethods Winner's Circle Members. The Winner's Circle is comprised of about 40 companies, divided into four groups, which meet three times a year to brainstorm, network, and problem solve. Personally, it was great to connect with several members of the group, some of whom are customers, and getting to know them. I had an opportunity to spend time with Gary Pica and Bob Penland, two innovators and leaders in the MSP field. Professionally, I presented my 6 Lessons Learned From Starting, Building, and Selling My MSP Practice slide deck which got a lot of conversation going. It was a phenomenal experience both personally and professional and here are a few reasons why the event was so fantastic: Everyone Was On The Same Page: All the members of the Winner's Circle are focused on growing their businesses, and are open to suggestions, ideas, and challenges from their peers. Although they had a good time together outside of the meetings, once they were seated at the table and in session, it was all business and everyone was laser focused. They Hold Each Other Accountable: Every participant had an opportunity to present their update in what is called the "Hot Seat". Although I couldn't sit in on the meetings, I saw everyone's reaction as they exited the "hot seat" session and it looked intense. These sessions are focused on feedback and holding each other accountable to their plans, strategies, and goals. Everyone Helps Raise The Bar: Gary and the TruMethods Team screens all their Winners Circle members and make sure they fit the criteria. If you start to fall behind or fail to pull your weight, you're out of the program, ensuring that everyone is on the same page. By being held to a high standard, the group has to elevate its performance, both collectively and individually. Small And Personal Is Unique: Today, everyone is trying to get as big as possible as quickly as possible. TruMethods takes a slower, more deliberate approach to growth. I asked Bob Penland why he didn't expand the groups, and he remarked that he liked the intimacy that comes with smaller groups. "I like that I know each of them, I know their business, their families, and their hobbies," he told me during dinner. Any MSP that is interested in growing their business, I would recommend reaching out to Gary and his team and get on the waiting list to join the Winner's Circle. You won't be sorry and your business will be better for it.

Tips To Making Clear Dashboards

Dashboards are the interfaces by which users encounter the numbers and graphics that are important to them. It's important that they be concise so that needed information can be found quickly. The making of effective dashboards is an art and science which has been the subject of several books. The typical complaint is that dashboards often provide more flash, dazzle and eye-candy entertainment than useful information. One author coined the term "dancing bear dashboards" to describe them. Cute displays lose their sparkle in a few days. An effective dashboard usefully summarizes real information. Simplicity is much preferred. The real goal of a dashboard is to communicate. The first challenge in designing an effective dashboard is to get the right information on it. The information has to fit the viewer's function. Sales staff may need a different information set than service managers, although all staff may find some kinds of information useful. The second challenge is to find ways to fit needed information on a single screen or easily managed sets of screens so the user can see what they need to see quickly. The third challenge is to get the information in a way that tells a story at a glance. Time dependent information in graphical form, designed to show progress or trends on key performance indicators, are very popular components of many dashboards. These graphs can be very confusing when data points are graphed in rough form. In order to smooth out confusing random variation, the data should be subjected to running averages to show the trends before the data is presented. Often data presentation has to enable the user to "drill down" into a graphed average to view its components or view regions of data points to analyze a trend or state of affairs in detail. Dashboards should also contain necessary warnings or caution signals. Deadlines and timelines should be included in easy to understand formats. Many times the most useful information is best presented simple tabular format. Often dashboards can integrate all or parts of the information employees use every day, like contact lists or time tables. These tables should be kept up to date and accessible. The end-user should be able to correct or modify the tabular information as they need to.

Security is a State of Mind

One of the most consistent and popular questions we get from prospective customers centers around security, specifically the security of our customer's data. With hacking scandals, photo leaks, and breaches in consumers credit cards data making headlines almost weekly, it's not hard to see why this is such a big concern. We are committed to the security of your data, and outlined below are some of the innovative ways BrightGauge works to keep your information safe. Security Is A Daily Priority: We believe security is integral to the success of both our business and your business, so we have integrated it into our everyday operations. Therefore we are constantly reviewing our security and evaluating ways to improve our security. Security has been top of mind since day one since both of BrightGauge's co-founders have a background in information security, having worked at another Dosal Capital operating company, Compuquip Technologies which is a leader in the IT infrastructure security space. Leave Infrastructure Management To The Experts: When we founded BrightGauge, we decided to make software development our primary focus and core competency. It's what we were best at as a team. By focusing on development, we looked to an outside expert to help us with IT security, and we decided to host all our infrastructure, physical controls, and network security with Amazon Web Services (AWS) in their US East Region. AWS has a fleet of network security professionals who monitor and manage our infrastructure 24/7, allowing us to focus on software development and customer service. All of the AWS infrastructure adheres to the latest security compliance guidelines, and goes above and beyond what we could manage and provide on our own. You can learn more about AWS and security compliance here. You Control The Data We See: It's entirely up to you, as a BrightGauge customer, to determine what kind, how much, and what type of data our platform accesses. As part of the implementation process for on premise data sources, we request that you establish a database user to get access to the database. However, we require it to have "Read Only" access, so our team is unable to write to your database. Essentially, the "Read Only" database user allows our agent to pull the data we need to create our default datasets. The default datasets, comprised of the most efficient, effective, and popular benchmarks, allow you to get up and running without having to build your own queries. If you decide you want to change the data our team has access to, we can help you edit, expand, or streamline the default datasets to limit or expand what information is pulled. We Use Our Proprietary Agent To Query Your Database: As part of our on premise data source implementation process, you will download our BrightGauge Agent and load it to your local network. Using the access created by the database user, we can efficiently, effectively, and securely transmit your data and information. Our proprietary agent does only two things, take SQL queries from BrightGauge and query the database locally to grab data quickly, and encrypt that data and send it back to BrightGauge on regular intervals. Send Data Securely: Our proprietary agent creates a secure SSL Tunnel between itself and the BrightGauge web servers. In order to add another layer of security, we ask our customers to open up a port in their chosen firewall and lock it down to our IP addresses. We only provide the IP addresses to our customers. Once a customer locks down that port, we have a secure channel to communicate the encrypted data. Additionally, we have measures in place to ensure that the data transmission goes smoothly. If the query starts to deliver too much data, our system rejects the query and stops the connectivity before your database becomes vulnerable to any issues. Storing Your Data: We use two types of databases at BrightGauge, and they are very well protected. In an effort to minimize any extraneous information that could be compromised, we only store the data for reports you have sent (under your control) and data between refresh cycles. The data being refreshed is always visible to our customers and the default datasets can be added, removed, or edited at your discretion. If you or anyone on your team has any additional questions about security please feel free to contact us and we can set up a call with our team to discuss in detail. You can get in touch by visiting: Get In Touch About Security

4 Common Pitfalls in Data Driven Decision-Making

Data-Driven Decision-Making, is trending in the business world. Organizations of every type, from school districts to banks, are implementing data-driven decision making to help increase efficiency. While data-driven decision making can help any business, it comes with its own set of challenges. Here are four common pitfalls in data-driven decision-making and how to avoid or overcome them in your business. Disparate Data Sources: Data comes in many forms, and not all of it looks the same. One team may have data stored in a remote monitoring and management (RMM) application, while another team has customer data in a PSA, and a different team has custom data stored in CSV files. To overcome the problem of disparate data sources, choose a data analysis tool that can import and organize data regardless of the source. Unclean Data: Your data analysis is only as good as your data. In many cases, unclean data comes from data entry errors, so occasionally audit your records to ensure they are high-quality. Additionally, make sure each variable you record is separate from other variables, and each record is uniquely identifiable - this is not a place you can take shortcuts! Poor Visualization: Do you know what your data actually looks like? Visualization is vital to using your data effectively. Free your data from the confines of spreadsheets and turn it into graphs, reports, and dashboards that your employees can use. Even better, allow your employees to create visualizations themselves for on-demand data analysis. Lack of Training: Data-driven decision-making is part of a company culture. In order for everyone involved in decision-making to get on board with data-driven decision making, they need to know how to use the data effectively and easily. Make sure to train your employees on using any software involved in your data-driven decision making process. Some of these pitfalls simply require care and forethought, while others require the right tool for the job. Be sure to carefully select the tools you use for your data-driven decision-making. If you need help with jumping into data-driven decision making, BrightGauge can help you take data from anywhere, visualize it on-demand, and train your employees on how to use it. To learn more about how you can use data to Improve Your Service Operations please click below or => Using Data To Improve Service Operations

Our Latest Content

// Siteimprove tracking