Blog Logo-2.svg

The BrightGauge Blog

How KPI Dashboards Can Help Your Business Grow

KPI is shorthand for “key performance indicator”. Think of KPIs as your key business objectives, things like monthly sales goals, new customers or employee productivity outcomes. KPIs are a smart way ...
KPI is shorthand for “key performance indicator”. Think of KPIs as your key business objectives, things like monthly sales goals, new customers or employee productivity outcomes. KPIs are a smart way for businesses to define their goals, to measure progress towards achieving them, and to make any necessary adjustments to those goals based on actual performance. Usually, KPIs are numbers, and generally those numbers are more or less complex depending on the size of your business. Simplifying Your Data and Improving Performance with Dashboards Most companies have multiple business objectives and to this extent manage a lot of data. KPI dashboards simplify all of that data into easy to read graphics, such as tables and charts. KPI dashboards are similar to other dashboards, like the one in your car that lets you quickly see important information like how fast you’re moving or how much gas is left in your tank. KPI dashboards are useful tools that help a business improve performance by providing key information to the stakeholders who need it, when they need it. Dashboards can be restricted to only those employees who need the information, allowing companies to manage their data while keeping proprietary information secure. One Size Doesn’t Fit All Because every business has a unique mission and set of business objectives, the software which fuels KPI dashboards can be customized to reflect the goals specific to your business and industry. For example, a real estate business will probably need dashboards which reflect aggregate sales, total sales for each agent, prevailing interest rates, and socioeconomic data, among others. A construction firm, on the other hand, might want to see dashboards which include job costing data, outstanding bids, and current clients. KPI dashboards are to some extent an educational tool, providing decision makers with the data that helps them understand their own business. More importantly, dashboards are an efficiency tool, allowing companies to better define their key objectives, monitor progress towards those goals and improve performance by making pinpoint strategic adjustments based on what they learn.
request-a-brightgauge-demo

Business Intelligence: Is it Time to Go Mobile?

Businesses of all sizes have incorporated business intelligence – the techniques and software used to transform an organization’s raw data into useful information – into successful strategic planning for decades. Now there’s a new player in town – business intelligence – and it’s sweeping the world. Forrester Research puts it this way… …The advent of smartphones and tablets has changed the dynamics of what mobility means in a business context. Whether it's executives or field engineers, knowledge workers or hospital staff, there is an increasing realization that extending business intelligence applications to mobile devices can transform entire business processes as well as individuals' work patterns. What Mobile Business Intelligence Means to an Organization Recent research suggests that 24 percent of businesses currently use or are in the process of adding mobile BI applications, while 37 percent are considering mobile BI in the near future. They understand that decision-making is not the responsibility of only a few select employees in organizations. The entire team makes decisions daily whether they’re in the field closing sales deals, traveling out of town on business, or moving product around a distribution center. Mobile BI enables organizations to: Boost employee and company performance Increase employee engagement Simplify operations Improve decision-making Whether you focus on a single group or implement it corporate-wide, mobile BI means connecting users anywhere around the world through mobile technology. No matter where you are, you can grab network patch status, server capacity, sales pipeline, and service team response times to gain a complete view of your customers. Ultimately, today’s workers need access to critical business information at a moment’s notice. As Boris Evelson, a principal analyst at Forrester Research, writes, “Information workers can no longer wait to make decisions until they get back to the office – that may be too late.” Sounds like it’s time for business intelligence to go mobile.

Subscribe to get the latest content delivered to your inbox

Tips To Get The Most Out Of Your KPIs

A key performance indicator is a measure of whether an employee, a team, or an organization's agreed-upon performance goals or results have been achieved or not. They are clear and quantifiable measures for the critical factors of success for an organization. KPIs typically include any combination of reports, spreadsheets, dashboards, and charts, and may include anything from personnel statistics and trends to supply management, and supply chain information. A key benefit of a KPI program is that is often motivates your entire team to meet goals. The following are a few simple tips to assist you in implementing a KPI program within your organization. Link to company objectives. Look at the key critical factors of your business. What are the things that make your business successful? Those are the things you need to make a part of your KPI. Spend your time where it matters most. Involve your colleagues. Making performance a team effort simply works better for achieving your objectives efficiently. This is a collaborative effort that includes everyone who is involved, with a focus on learning and growing employees. Less is more. You don't want too many key indicators. Focus on the most important and most relevant ones. Only collect data that is useful. Data that strays from the purpose of your performance measures will leave you with data you neither need nor use. Make them measurable. Don't get carried away here. Keep it simple. Go for the basics, just be sure they mean something to your business. If it's meaningful to you, then you will be able to make better decisions. Analyze with a human touch. Data and reports can only tell you so much. Be sure you try to understand how outcomes relate to behavior. Get a weekly report. You should have your team reporting to you on a weekly basis. Don't wait until the end of the month to look at these numbers. KPI programs are intended to improve accountability while being able to withstand organizational changes. With the above tips in mind, you can utilize your KPIs to monitor progress, set alerts if something is awry, and communicate the importance of reaching each goal. To learn more about what KPIs you should be using to manage your team better please check out our white paper: Internal Metrics That Matter For MSPs

Choosing the Right KPIs for Your Organization

Organizations that are looking to make and execute better decisions will benefit from using key performance indicators (KPIs) to determine how they are performing in relation to their goals and objectives. However, to do it successfully you must learn how to choose the right ones for your organization. Purpose of Key Performance Indicators Key performance indicators allow organizations to improve the performance of the organization as well as the individuals within the organization. Specifically, they allow you to: Increase productivity. You don’t want people doing busy work or focused on the wrong things. Establishing KPIs allows you to determine whether your team is working toward the right goals and what adjustments need to occur to keep productivity high. Improve performance. KPI metrics provide a measuring tool for determining if employees are performing at the level expected for their role within the organization, while assisting the company reach its strategic objectives. Make better decisions. Choosing the appropriate actions to take depends on the goals you want to reach. KPIs help reduce uncertainty by providing a basis for determining which decisions will lead you in the right direction. KPIs are a useful tool for creating a high-performing culture. They allow you to balance quantitative and qualitative measures to understand desired performance. Choosing KPIs for Your Business Choosing the best KPIs for your business requires you to understand the basic concept behind their development. First, for it to be a key indicator it must be critical and relevant to the organization’s success. As this Industry Week article suggests, KPIs should measure performance toward the strategic objectives that you’ve laid out as part of your operations strategic plan. It is absolutely critical that these KPIs measure the most important factors in achieving your success. Stay away from the minutia. Next, KPIs must be quantifiable, controllable, and repeatable. If team members cannot influence the outcome, you’ll find it difficult to gain their buy-in. Selected KPIs might include improved customer service response rate, increased revenue from the sales team, or a decrease in past due receivables. Finally, a key indicator means the outcome or expectations are measurable. KPIs are a gauge. They should have a specific expected outcome that you can track over time. When it comes to choosing the right KPIs for your organization, consider your main purpose is to determine how to drive business performance. For more information on key performance indicators, business intelligence, and related topics, review our website, read our blog, and follow us on Twitter. To learn more about what KPIs you should be using to manage your Service Team better please check out our webinar Establishing & Managing Your Key Performance Indicators for MSPs.

What We Learned At DataStax Tech Day

We recently attended the DataStax Tech Days for Apache Cassandra at the JW Marriott here in Miami. The seminar was hosted by Rob Murphy, Solutions Engineer at DataStax. If you are not familiar with DataStax they provide big data solutions using Apache Cassandra along with other technologies to some of the leading tech companies in the world. Cassandra, is an open source NoSQL database system that was originally created by Facebook back in 2008. At BrightGauge, we use Cassandra as one of our backend database solutions. Though we are very happy with what Cassandra provides us today, we wanted to learn about how to take more advantage of its feature sets. So far Cassandra has not required much maintenance and has worked out of the box as advertised. For this reason, we went to this session to figure out what else we can throw at it! Rob Murphy gave an introduction to Cassandra. He gave a high level overview of how Cassandra works, how it differs from a traditional RDBMS and its tunable consistency feature. One of the biggest hurdles when using Cassandra, is understanding the data model for storing and retrieving data. Rob did a great job of using real world examples to show how data should be modeled for efficiency in Cassandra. We also got to take a look at some of the software DataStax has created to work with Cassandra. Their OpsCenter and DevCenter applications, make interacting with and managing Cassandra a breeze. This was followed by a tour of the DataStax Enterprise feature set, which was quite impressive. Robbie Strickland, Software Development Manager at the Weather Channel, then presented examples of how Cassandra solves a lot of the data problems that they encounter on a massive scale. The Weather Channel pulls in vast amounts of data from a variety of different sources (puts our data requirements in perspective). They have used Cassandra in very creative ways. For instance, they are currently using it as a cache instead of the “out of the box” memcache which he said has drastically increased the speed that they can get their data into their users hands. The Weather Channel also leverages Cassandra’s tunable writes to handle floods of location data inserts. They receive constant updates from the 100M users that are currently using their mobile apps. The insights he shared opened our minds to the continuing possibilities of using the technology in different aspects of our software. The day session was fantastic and confirmed some base assumptions we’ve made and tested thus far in our architecture. And ultimately, Cassandra is one less headache within an advanced technology stack that we have at BrightGauge. That, and Cassandra’s speed, makes this database solution the most attractive NoSQL solution for our small team!! Thanks DataStax for the session!

70+ Metrics for MSPs

Key metrics and accompanying formulas to help MSPs skyrocket growth and success!

Get your KPIs

Establishing & Managing Key Performance Indicators for MSPs

This is one webinar you won’t want to miss! We just wrapped up one of our most successful webinars on the topic of Establishing & Managing Your Key Performance Indicators (KPIs), specifically geared towards Managed Services & IT Services Providers. This was the 2nd installment of the BrightGauge Educational Webinar Series which kicked off with a session on How To Increase Efficiency & Profitability Through Service Management Excellence. During this 50 minute session, Veteran MSP Operations Coach Rex Frank of Sea-Level Operations guided us through the key metrics every MSP & IT Service Provider owner and/or Executive should be monitoring and managing. He shared several best practices on each metric and real life examples that you can immediately implement in your company. The webinar is broken up into sections to make it easy for you to share the necessary portions with the appropriate team members. The key sections include: Leading vs. Lagging Indicators Indicators vs. Key Indicators Sales KPIs Finance KPIs P&L Based KPI's Service KPIs To download visit: http://info.brightgauge.com/establishing-managing-kpis

MSP Customer Case Study: Community IT

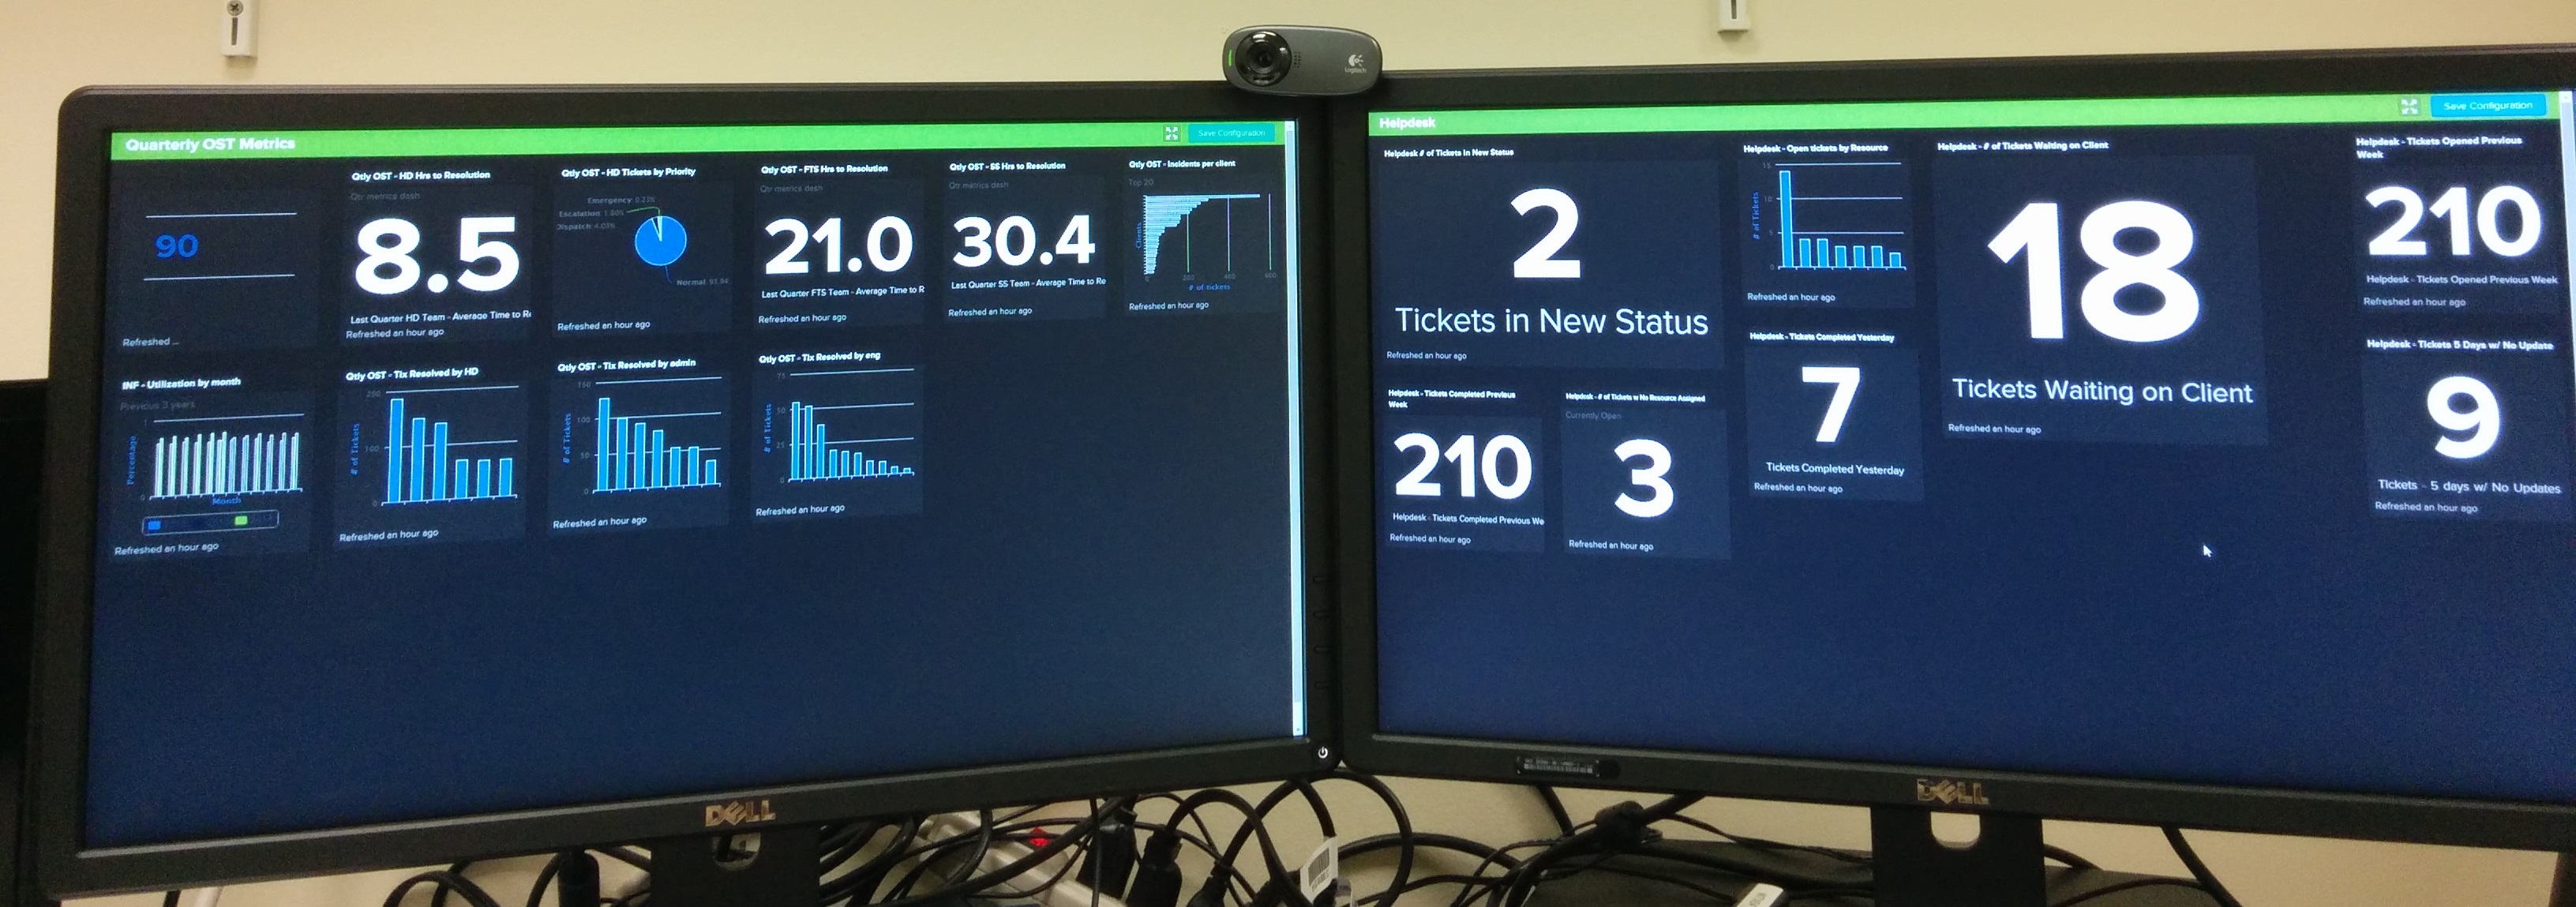
Johanny Torrico is the main BrightGauge admin within the fast growing Community IT Innovators based in Washington D.C. As the Director of Network Support Services at Community IT she wears many hats and is constantly looking for ways to bring efficiency into her day to day work routine. Below Johanny shares a real life case study of how she and her team get the most value from BrightGauge. ================== Since data is stored in a variety of places and many different applications are used to perform essential business functions, identifying and defining the metrics which are important and relevant to informing performance, allocating resources, and maintaining operational efficiency is both crucial and challenging. A few years ago, Community IT's leadership team established a set of team and company Key Performance Indicators (KPIs). Pulling the data was tedious and time consuming. Managers had to run canned reports from our Professional Services Automation System (PSA) or create complicated pivot tables from CSV exports or direct SQL connections. In addition to being time consuming, we found the end result was often inaccurate and incorrect. Community IT started to explore other reporting tools, which better integrated with our PSA system and tested them. BrightGauge, which had recently matured its services, had also added a dashboard and a number of different gauges to its product. We decided to pilot the BrightGauge system, and ultimately partner with them as our reporting system. BrightGauge has simplified our job in many ways, and here are the top four: Help Desk Performance Monitoring: Live and real time information about our help desk's performance is critical to delivering quality services to our clients. Basic indicators, including response and resolution time of both the team and the technicians, identifying aging tickets, and easily accounting for the number of tickets submitted after hours, were all tasks that required a manager to do a lot of manual work. Hardware Inventory: This was another task that required manual intervention and, on many occasions, a physical site visit. BrightGauge, along with our monitoring system, allowed us to automate the creation of the report and saved us from making expensive and time consuming site visits. Proactive Services: The BrightGauge platform gives us an opportunity to proactively notify our clients when their warranties are about to expire. Client Services: As part of our Managed Service offering, we meet with most of our clients regularly. Preparing for these meetings required us to run a number of different reports, focusing on tickets, system alerts, and budgets, all of which could take between two and three hours to execute. Now, by using BrightGauge, these reports are pre-set, and are automatically delivered to the team and the client. Now, instead of spending valuable resources generating reports, the client and the manager can spend their time focusing on the results. Developing the right set of KPI's is important, but it's only half of the equation. To fully understand and leverage the information your KPIs provide, you need a tool that delivers accurate and consistent information. BrightGauge has allowed us to continue to monitor our current KPI's and develop additional metrics for both teams and individuals. The implementation of the BrightGauge platform has allowed us to utilize our resources more effectively and efficiently, which leads to lower costs and improved services for our clients. To learn what others are saying about BrightGauge visit the BrightGauge Buzz page and below is a screenshot of a set of Johanny's dashboards she keeps at her desk.

Free Webinar: Establishing & Managing Your Key Performance Indicators for MSPs

Earlier this year, we kicked off the 2014 BrightGauge Educational Webinar Series with a session on How To Increase Efficiency & Profitability Through Service Management Excellence. During the session, MSP Operations Coach Rex Frank of Sea-Level Operations guided us through his 10 Step Operations Plan. This plan outlines the 10 steps that every Service Manager and organization should follow to increase efficiency and profitability. After the webinar, we polled the participants to determine which of the 10 steps they wanted to learn more about, and after several hundred votes were cast, the clear winner was Establishing & Managing MSP Key Performance Indicators. So, we're bringing Rex back for another round, and will be taking a deep dive into the topic. We guarantee you'll learn best practices and strategies that you can immediately implement to make your operations plan run more efficiently. During the session, Rex will cover topics like: Leading vs. Lagging Indicators Indicators vs. Key Indicators Sales KPIs Finance KPIs Service KPIs P&L Based KPI's As usual, we want to accommodate our global community, so we will be hosting the same call twice, on June 18th. Please RSVP to the one session that best fits your schedule by clicking the date/time link: June 18th at 10:30am or June 18th at 7:30pm (both EDT)

Gartner Business Intelligence & Analytics Conference Recap

Last month, my brother and I attended Gartner's Business Intelligence and Analytics Summit in Las Vegas. For those unfamiliar, Gartner is a large and well respected American information technology (IT) research and advisory firm, and they publish the Annual Gartner Magic Quadrant Reports. These reports rank each company in every product or sub-industry within the IT business community. Since many companies, especially enterprise companies, rely on these reports when selecting vendors and making technology decisions, the reports serve as a "Who's Who" in the industry. BrightGauge is a newcomer in the Business Intelligence (BI) vendor space and we felt there was no better time to attend a conference like this than in our early years as a BI platform. The conference did not disappoint. It was a tremendous learning experience about what enterprise customers are looking for in BI solutions and what vendors who focus on enterprise customers are building into their platforms and solutions. Here were my three takeaways from the conference: Everyone wants to make data driven decisions. I mean everyone. From enterprises, to small business, to consumers, all our customers want to understand and interpret their data in order to determine the most meaningful answers to their challenges. Although getting a Google or Siri in front of everyone's business data is still years away, that is the ultimate goal. Investments are being made so this becomes easier for everyone. Traditionally, enterprise companies depend upon their IT departments to help define what type and what volume of data is needed to make good business decisions. The new model begins to eliminate the IT or BI department from the equation of decision making. Investments are being made in order to equip business users with the tools they need to visualize their data and create the metrics they need to monitor their business activities. Today's businesses are not really large enough to support true BI departments, but they are sophisticated enough to manage their own data with a little direction. Data is Everywhere. Spreadsheets, sale numbers, in house customer service information and social media sites all contribute to the volume of data companies create every day. Each of these systems have their own reporting and dashboard functionality, but when not viewed together, this information creates an incomplete picture and profile. The BI industry helps companies consolidate, visualize, and take action on ALL their data. Fortunately we also learned that at BrightGauge, we have and are currently building all the main pieces needed for an Enterprise Business Intelligence solution. This provides us great confidence that our market, the Fortune 1,000,000, will be able to leverage the Enterprise class features and functionality we are building. Which will help make our customers as competitive as they need to be in order to compete in their markets. A true win, win for everyone!

BrightGauge Dashboards using Google Chromecast

At BrightGauge, we are always looking for feedback from our customers. As a result we rolled out a new update that enhances the BrightGauge experience on large monitors. The new TV dashboard feature dulls the background and optimizes the viewing area, making the entire experience more intuitive and user friendly. As a software company, we tend to focus on the products that deal with 1's and 0's, as opposed to working on the hardware portion of our customers' experiences. When Karl Fulljames of Nucleus Networks adapted and implemented BrightGauge's technology with Google's new Chromecast feature, we were thrilled with his initiative and out of the box thinking. At BrightGauge, almost everyone uses Google Chrome as their browser, but we often find that Mozilla Firefox offers the best experience. Karl took our recommendation for using Chrome a step further, and integrated the product with the Google's streaming service, Chromecast. As a result, Nucleus Networks can now see their dashboards on televisions throughout the office. One of the challenges of Chromecast is that you need a dedicated computer for each Chromecast. Karl set up a small box and ran multiple Chromecast extensions via a small fork of Linux. This immediately freed up three machines that had previously been dedicated to Chromecast and BrightGauge. At BrightGauge, we value the innovation that comes from quality interaction with our customers. After Karl's successful experiment, we wanted to see how we could optimize other features of Chromecast. We are now using Chromecast to show our own internal features, and the occasional YouTube video. Our experience with Chromecast reminded everyone at BrightGauge that customer service is a two way street. We strive to provide our customers with ways to make their businesses run smoother, and when we listen to their feedback, they can help us make our products better. Thank you to Karl and all the BrightGauge customers who are helping us shape the future of BrightGauge.

Kaseya Connect 2014 Conference Summary

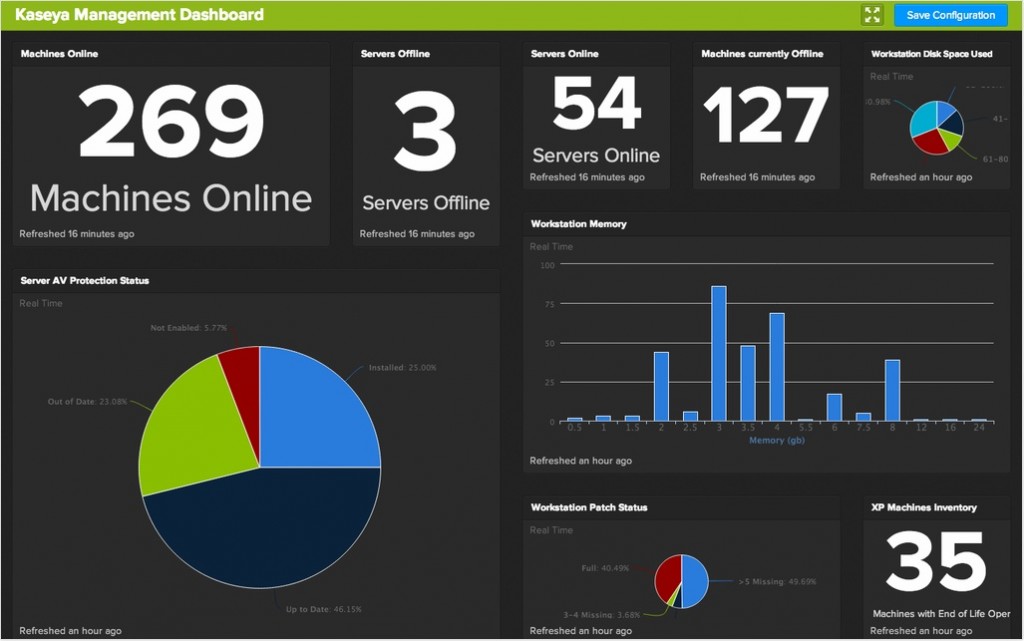
The BrightGauge team attended the Kaseya Connect Conference in Las Vegas, and we had a phenomenal time. We attend these conferences for three main reasons: To educate our team on current market and industry trends. Meet with customers who are attending the event. Connect with prospects who have shown an interest in our product. The conference did not disappoint, and we had many great opportunities to meet with clients and potential customers. We also got valuable insight into the future of our industry and the opportunity to hear specifically about the direction of one of our key integration partners. Here are four important takeaways: Kaseya is committing to the Cloud. This interesting announcement was met with some pushback. This is a big change, and not everyone is comfortable with moving to the cloud. At BrightGauge, we are excited to hear that a large MSP player is considering a 100% move to the cloud. I predict that there will be some continued resistance to the move from Kaseya On Premise Partners who enjoy the flexibility of having their system on the premise. We can expect additional integrations. Most of the new Kaseya Management Team comes from Computer Associates and SalesForce.com, both of which have well integrated software platforms. The management team hinted that not only are more integrations are on the way, but these integrations will be tighter, making everything more seamless. Everyone is bullish on the MSP Industry. As we walked around the conference, we couldn't help but notice the positive energy around us. There were many conversations about industry growth and client acquisitions. Given that our target audience is MSPs and IT Service Providers, it was comforting and encouraging to hear positive feedback and witness the momentum they are experiencing. Dashboard and Reporting is a top priority. One of the largest and best attended breakout session was on Dashboard and Reporting. Most participants are asking for more access and customization capabilities with their data. Currently, many companies utilize a third party tool, like BrightGauge's technology, to streamline and manage their reporting. We left with some great ideas for our new Kaseya Management Dashboards (see the image below), which we have already made available to our partners. We really enjoyed the three days of learning with and from some of our industry's experts and thought leaders. The best part of the trip, however, was the Customer Happy Hour we hosted. It's always great to connect and chat, in person, with folks from our community. At BrightGauge, we know that nurturing these connections and relationships are as, if not more important, than attending any breakout session. To learn how you can leverage BrightGauge's custom reporting and dashboards with your Kaseya platform please visit: http://www.brightgauge.com/kaseya/

Our Latest Content

// Siteimprove tracking